CAT 2019 Question Paper | CAT LR DI Slot 2
CAT Previous Year Paper | CAT DILR Questions | Question 30
Often times, CAT DILR is considered a monster. But not all questions in this section are difficult. This Data Interpretation set based on simple Spider Graphs should tell you how important choosing the right set is when it comes to CAT DILR. CAT Previous Year Paper is the best place to start off your online CAT preparation. To check out about 1000 CAT Level questions with detailed video solutions for free, go here: CAT Question Bank
CAT DILR : CAT 2019 Question Paper Slot 2
Set 8 : Revenue & Cost
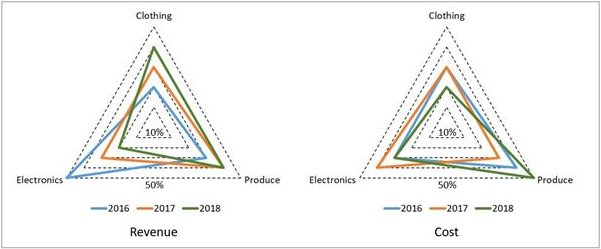
A large store has only three departments, Clothing, Produce, and Electronics. The
following figure shows the percentages of revenue and cost from the three departments for the
years 2016, 2017 and 2018. The dotted lines depict percentage levels. So for example, in 2016,
50% of store's revenue came from its Electronics department while 40% of its costs were incurred
in the Produce department.

In this setup, Profit is computed as (Revenue – Cost)
and Percentage Profit as Profit/Cost × 100%.
It is known that
1. The percentage profit
for the store in 2016 was 100%.
2. The store’s revenue doubled from 2016 to 2017, and its
cost doubled from 2016 to 2018.
3. There was no profit from the Electronics department in
2017.
4. In 2018, the revenue from the Clothing department was the same as the cost incurred
in the Produce department.
Question 2 : What was the ratio of revenue generated from the Produce department In 2017 to that in 2018?
- 8 : 5
- 16 : 9
- 4 : 3
- 9 : 16
Best CAT Online Coaching
Try upto 40 hours for free
Learn from the
best!
2IIM : Best Online CAT Coaching.
Video Explanation
Best CAT Coaching in Chennai
CAT Coaching in Chennai - CAT 2022
Limited Seats Available - Register Now!
Explanatory Answer


The question is "What was the ratio of revenue generated from the Produce department In 2017 to that in 2018?"
Hence, the answer is 8 : 5
Choice A is the correct answer.


