CAT 2024 Question Paper | DILR Slot 2
CAT Previous Year Paper | CAT DILR Questions | Question 20
CAT 2024 DILR did not have a change in pattern. Atleast two sets were doable in each slot and one of the four sets was extremely tough. Choice of Sets became a crucial factor. Overall this section was at a medium to high level of difficulty.
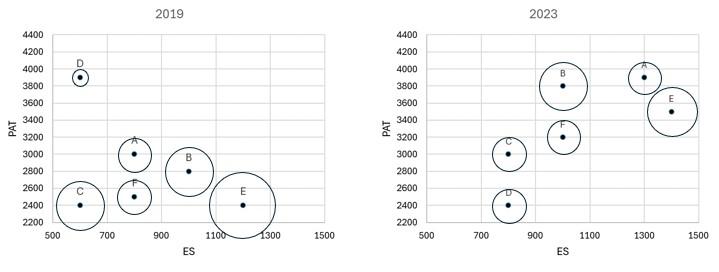
The two plots below give the following information about six firms A, B, C, D,
E, and F for 2019 and 2023.
PAT: The firm's profits after taxes in Rs.
crores,
ES: The firm's employee strength, that is the number of employees in the
firm, and
PRD: The percentage of the firm's PAT that they spend on Research and
Development (R&D).
In the plots, the horizontal and vertical coordinates of point
representing each firm gives their ES and PAT values respectively. The PRD values of each
firm are proportional to the areas around the points representing each firm. The areas are
comparable between the two plots, i.e., equal areas in the two plots represent the same PRD
values for the two years.
Question 20 : The ratio of the amount of money spent by Firm C on R&D in 2019 to that in 2023 is closest to
- 5 : 9
- 9 : 5
- 9 : 4
- 5 : 6
9 : 5
Best CAT Online Coaching
Try upto 40 hours for free
Learn from the
best!
2IIM : Best Online CAT Coaching.
Video Explanation
Best CAT Coaching in Chennai
CAT Coaching in Chennai - CAT 2022
Limited Seats Available - Register Now!
Explanatory Answer

The question is "The ratio of the amount of money spent by Firm C on R&D in 2019 to that in 2023 is closest to"
Answer:
Amount of money spent by any firm is proportional to areas on the firm’s PAT.
The amount of money spent by Firm C on R&D in 2019 = 2400 * π * 1.5 * 1.5.
The amount of money spent by Firm C on R&D in 2023 = 3000 * π * 1 * 1.
Ratio = (2400 * 1.5 * 1.5) / (3000 * 1 * 1) = 9 / 5.
Hence, the answer is '9 : 5'
Choice B is the correct answer.


