
Concepts discussed on August 19, 2017
Data Interpretation - Unconventional Charts Part 2
Welcome to the live session of Data Interpretation - Unconventional Charts Part 2. The concepts and questions discussed on August 19, 2017 during the live session follow the embedded video. The video link next to each concept will take you to the start of the part of the video where that specific concept is discussed. Click the video embedded below to watch the entire session.
-
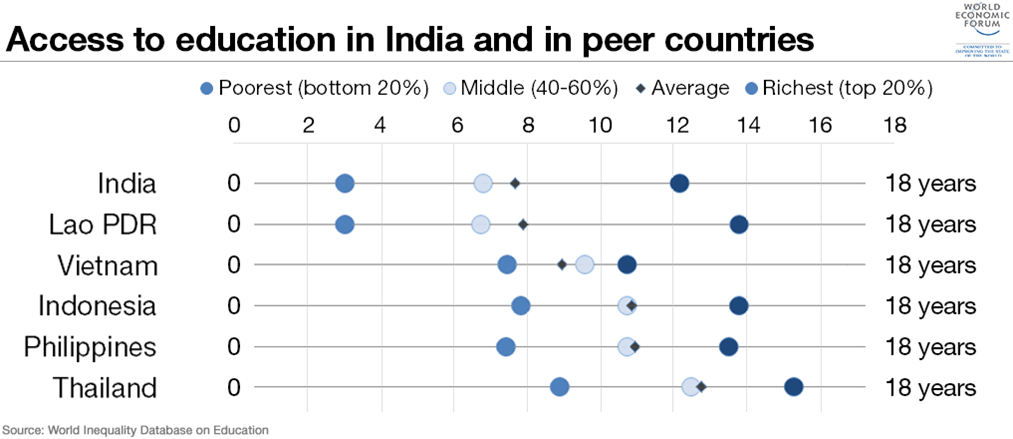
Which Country is doing the best?
-
Which Country is likely to be run by socialists?
-
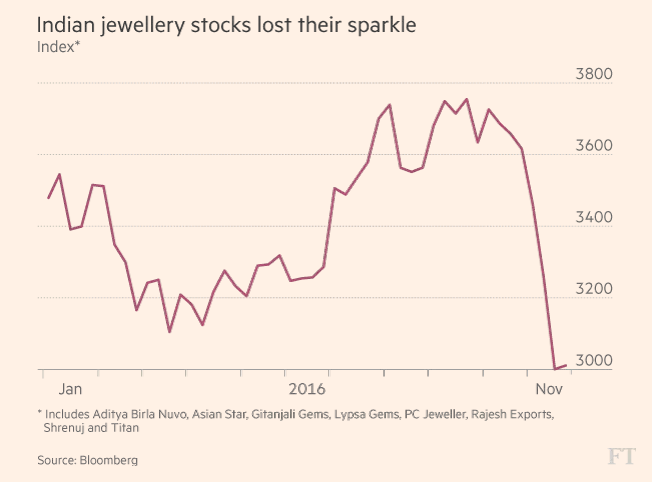
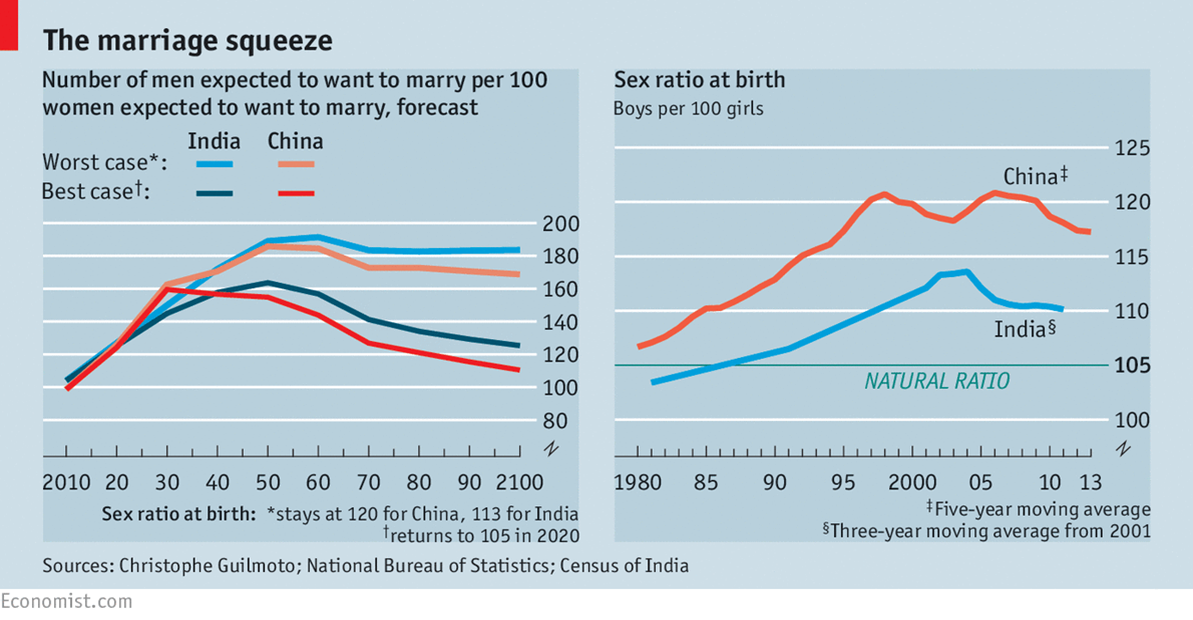
What can you infer from the given chart 1?
-
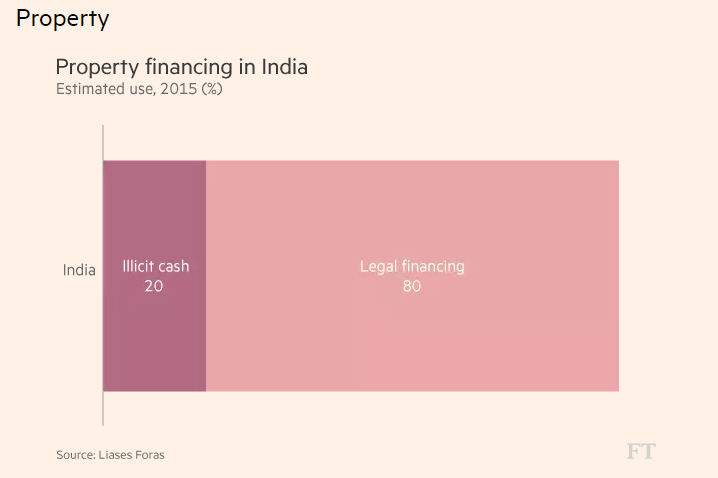
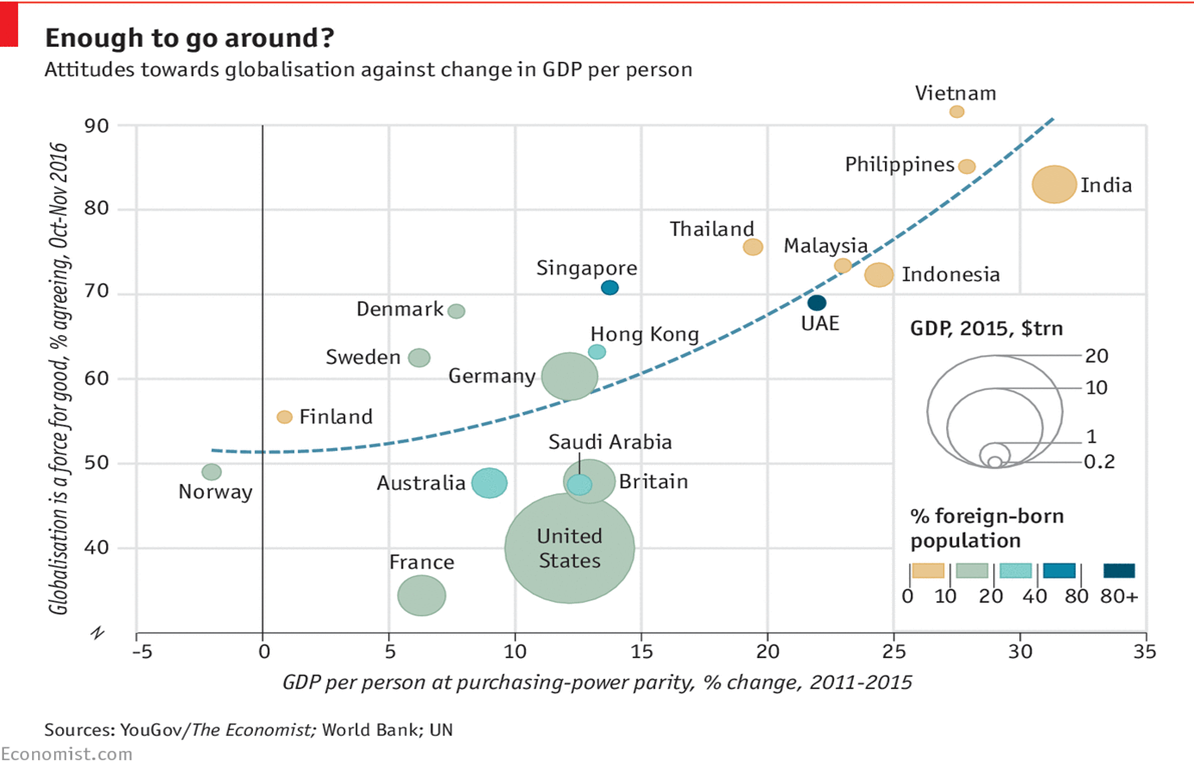
What can you infer from the given chart 2?
-
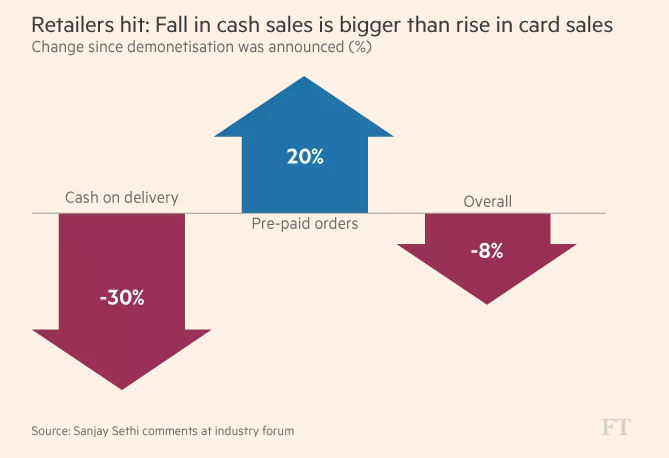
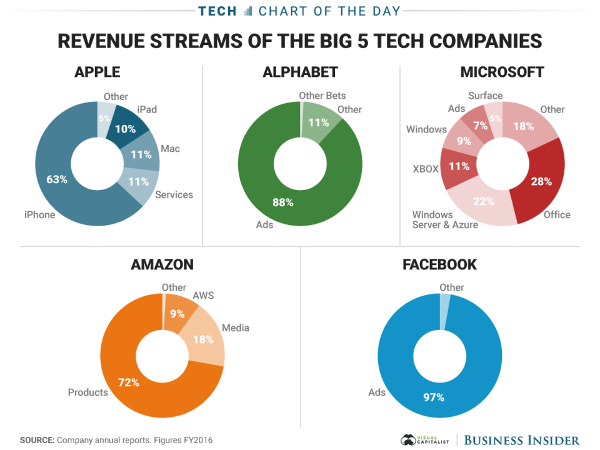
What can you infer from the given chart 3?
-
What can you infer from the given chart 4?
-
What can you infer from the given chart?
-
What can you infer from the chart given?
-
What can you infer from the chart given?
-
Which of these is likely to be the highest?
Unconventional Chart 1
Observe the charts given below and answer the following questions:
Unconventional Chart 2
Observe the four charts given below carefully and answer the following question.

Unconventional Chart 3
Observe the chart given below carefully and answer the following question.
Unconventional Chart 4
Observe the chart given below and answer the following question.
Unconventional Chart 5
Observe the chart given below and answer the following question.
Parallel Track
For which age is the batting average the maximum? As in, if we took average of all 25-year olds, all 26-year olds, all 27-year olds, etc., which of these is likely to be the highest?