2IIM Online CAT Coaching CAT 2020 Response Sheet Analysis
Know(Guess) where you stand!
Post the release of the CAT 2020 Response Sheets, we put out a 2IIM Score Calculator to help candidates breeze past the tedious counting, nervousness and recounting. The data that we collected from the entries gave us ample opportunities to dive deep into crunching this data (and also have some fun!)
A small note: We decided to make the data available to everyone to promote transparency and have also made it a point to anonymize the data. The nature of this endeavor was purely analysis-driven and not a Trojan Horse sent out to collect personal data from the entries.
We’re going to dive deep into what the data is telling us, and yes, it is telling us quite a lot. I’m going to outline what we’re going to do, what we’re NOT going to do and what kind of data sets we have.
Prepare for XAT 2021 with the 2IIM Advantage! Enroll Now
1) We have a large data set but it is heavily biased
What do I mean by that? Well, we've got more than 6000 data points, which is actually quite significant because the data set is large for the population that we have (CAT 2020 candidates). If the data had been picked randomly, it would have been sufficient, but the sample is not random, so definitely keep that mind.
The people who are going to come in and click on 'submit', upload their URLs and see their percentiles are definitely the more 'clued-in' aspirants. They will submit, and it is more likely their friends, cousins and fellow students also submitted.
The point is, we're going to have a heavy bias towards more intense, better prepared and higher scoring aspirants. So definitely keep that in mind as we go forward and look at some of our charts and graphs. Our data set is not representative of the entire population of the CAT 2020 Candidates. It is going to be biased towards higher scores, with the averages, means and medians following suit.
2) We have shared our entire data set
This was something we were pretty staunch about since the inception of this analysis. We will share our entire data set and be completely transparent with the numbers we have worked with. As mentioned earlier, the data is anonymous. We do not collect registration numbers, email IDs, phone numbers or any personal information.
Here is the URL for downloading our data set, so do have fun with it. If you come up with some beautiful analysis of the data, please do share it with us! We will publish the best pieces of research on our blog and offer wonderful discounts on our Online CAT courses to the top 3 analyses.
For a second, just forget about the discounts and publications. Quite a few people are keen about data analytics. This wonderful data set we have shared is from an intriguing exam and we are giving it to you on a platter. Definitely look to take a few hours out, poke around the data and see what you can glean from it.
Download the DATA here : Download here
We cannot make any direct percentile inferences but we CAN compare Slot 1 vs Slot 2 vs Slot 3
We cannot make any direct percentile inferences. We cannot say 90th percentile in this data will correspond to 99th overall or 95th overall because we know that the data is biased, and we don't know how it is biased in comparison to the entire population.
There is no way we can make specific percentile or score inferences.
One may argue and ask what the point of all of this is. What's the point of analysing the data if those crucial pieces cannot be conveyed? Well, we are here to say that there are OTHER ways of getting those crucial pieces.

So we will definitely try and take a stab at this, but it will be at a more generic, speculative level. We'll take some educated guesses but we will also take you through the process of how we got to those educated guesses.
Which slot was tougher and for which section?
4) We can compare VARC vs LRDI vs Quants
Which section was the toughest out of all the three, in terms of scoring, error rates and slots? We will definitely be looking into that as well.
5) We will also take a stab at normalization
There is a detailed and wonderful normalisation formula that has been given by IIMCAT, which we shared with our team for our sample analysis. We plugged in everything and had a go at that as well, so we will outline that broadly.
Definitely go through that as well. It is worth taking a look at, even though it falls under reasonably heavy-duty mathematics.
6) Let's have fun!
Enough said. :P
This is going to be a long-ish post. We spent a lot of time and tried to compress everything into a bunch of nuggets to consume, only to find out it doesn't really work that way. We cannot shared insights without the data...otherwise it just becomes a bunch of opinions.
We've tried to strike a balance between providing an outline and keeping it reasonably short and pithy, so let's go ahead.
Overview of data submitted through 2IIM Score Calculator
What is the data telling us at the headline level? We took each Slot: 1, 2 and 3, and then we took the mean and standard deviations of all three sections. What does this tell us?
This data tells us which section is the toughest in each slot in terms of scoring marks. It also tells us how volatile each section is.
A quick update: I'm not going to make a lot of inferences based on just Table 1.0. For a holistic understanding of the inferences, definitely keep reading and stay with us as we go further. The subsequent tables and slides will help us discuss those inferences.
Before we start, a quick detour into statistic is in order. The Mean is the average. Take all the data points and divide by the total number of entities, and you get the mean.
The Standard Deviation is a complicated computation. To get a sense of what it is, I'll briefly touch upon on. SD gives us a sense of how volatile the data is.
Those of you who watch cricket, if you take Dravid's batting average, which is likely to be 50-52, and take the Standard Deviation, it is likely to be very low. That means that when he scores, he scores consistently and his scores do not jump up and down.
In comparison, if you take Afridi's scores, it is likely to be very volatile, jumping from 0 to 120. In other words, his Standard Deviation is very high.
The point is that the heavily volatile sets are likely to have higher standard deviations with respect to the mean, and the scores are jumping about. The more consistent and steady sets will have low standard deviations with respect to the mean.

Table 1.0
As you can see in the above table, there are already some stark pointers sitting there. You can already discern that the means of the three slots are varying and that means something. Definitely have a look at it and test your hypotheses out. It is a lovely table that captures the essence of the data we are working with.
Instead of doing the overall thing, we decided we'll go section by section. Across the three sections: VARC, Quant and DILR, which slot, of the 3, has been the tougher or easier than the other 2?
Get free access to 2IIM's XAT Question Bank Click here
VARC - Comparison across Slots

Table 2.0
Take a look at Table 2.0. The purple one is Slot 1, the green one is Slot 2 and the red one is Slot 3. This is the percentile based on the data set that we have, so remember that. What we've drawn here in the y-axis are the marks, and the x-axis is for the percentiles.
Remember the 50th percentile you see in Table 2.0 does NOT translate to 50th percentile overall in this section.
The actual percentile for the scores is going to be much higher than this. This is just an axis to merely facilitate comparison across slots.
In order to look at the data more clearly, we've cutoff the really big scores and the bottom 100 scores, because they skew the data and make the chart look weird. We needed to get to the mean of the data.
Insight: Slot 1 VARC is significantly tougher than VARC across the other 2 slots.
This is one insight that stands out when you look at Table 2.0. The other 2 slots are practically the same.
Ironically, the general feeling at the end of the exam was not this. People were saying VARC was tough, but not many were saying Slot 1 VARC was tough. As you can see, Slot 1 VARC is not slightly tougher, it is off-the-charts tougher compared to the other 2 slots, which is an important point to note.
DILR - Comparison across Slots

Table 3.0
What does Table 3.0 say? Slot 1 scores appear to be higher than those of Slot 2 and 3, probably not as significantly higher than the difference between VARC Scores, but higher nevertheless.
Insight: Slot 1 DILR is a couple of notches easier than Slot 2 and 3.
The other 2 Slots are quite similar.
Quant - Comparison across Slots

Table 4.0
Insight: Slot 3 Quant was easier than the other two slots.
This is quite interesting, because quite a few of us said that Slot 3 was the toughest. However, Slot 1 VARC was the toughest, Slot 1 DILR was the easiest, so that definitely cancelled out. And accounting for the fact that Slot 3 Quant was the easiest, it is safe to say that Slot 3 (perhaps :P) was NOT the toughest amongst all three slots. Slot 1 and 2 Quant appear to be more or less on the same level.
This was definitely shocking for us (and quite amusing I might add), because a bunch of us insisted that Slot 3 was the toughest amongst all three after the exam.
Definitely keep Tables 1.0, 2.0 and 3.0 in mind, because these are the tables that will form the bedrock of our attempt at normalization.
Relative Scoring - Which section was the highest scoring section?

Table 5.0
Which section is the one to bring in the highest marks? The general hypothesis is that it is likely to be Quants. If you look at Table 5.0, the red line is DILR (refer to the legend), which is the least scoring section. The highest scoring section for the vast majority of our sample appears to be VARC. For high scorers, Quant seems to be the higher scoring section.
There are quite a few folks in our country who are going to have a compelling advantage in Quants. There are going to be lots of guys who are going to be scoring higher than 35 in Quants, and that group is large. That is likely the cause of the legacy of the IIT brigade and the JEE preparation cliques. So that is the most probable cause for the spike in Quant Scores are the ranks improve.
Insight: On an overall basis, the highest scoring section appears to be VARC.
So just a general heads-up: Definitely do not ignore your VARC and DILR Sections during your CAT Preparation. There tends to be a Quant heavy bias, so don't let that cloud that the fact that there are three sections in this exam.
Was Slot 3 the toughest overall?
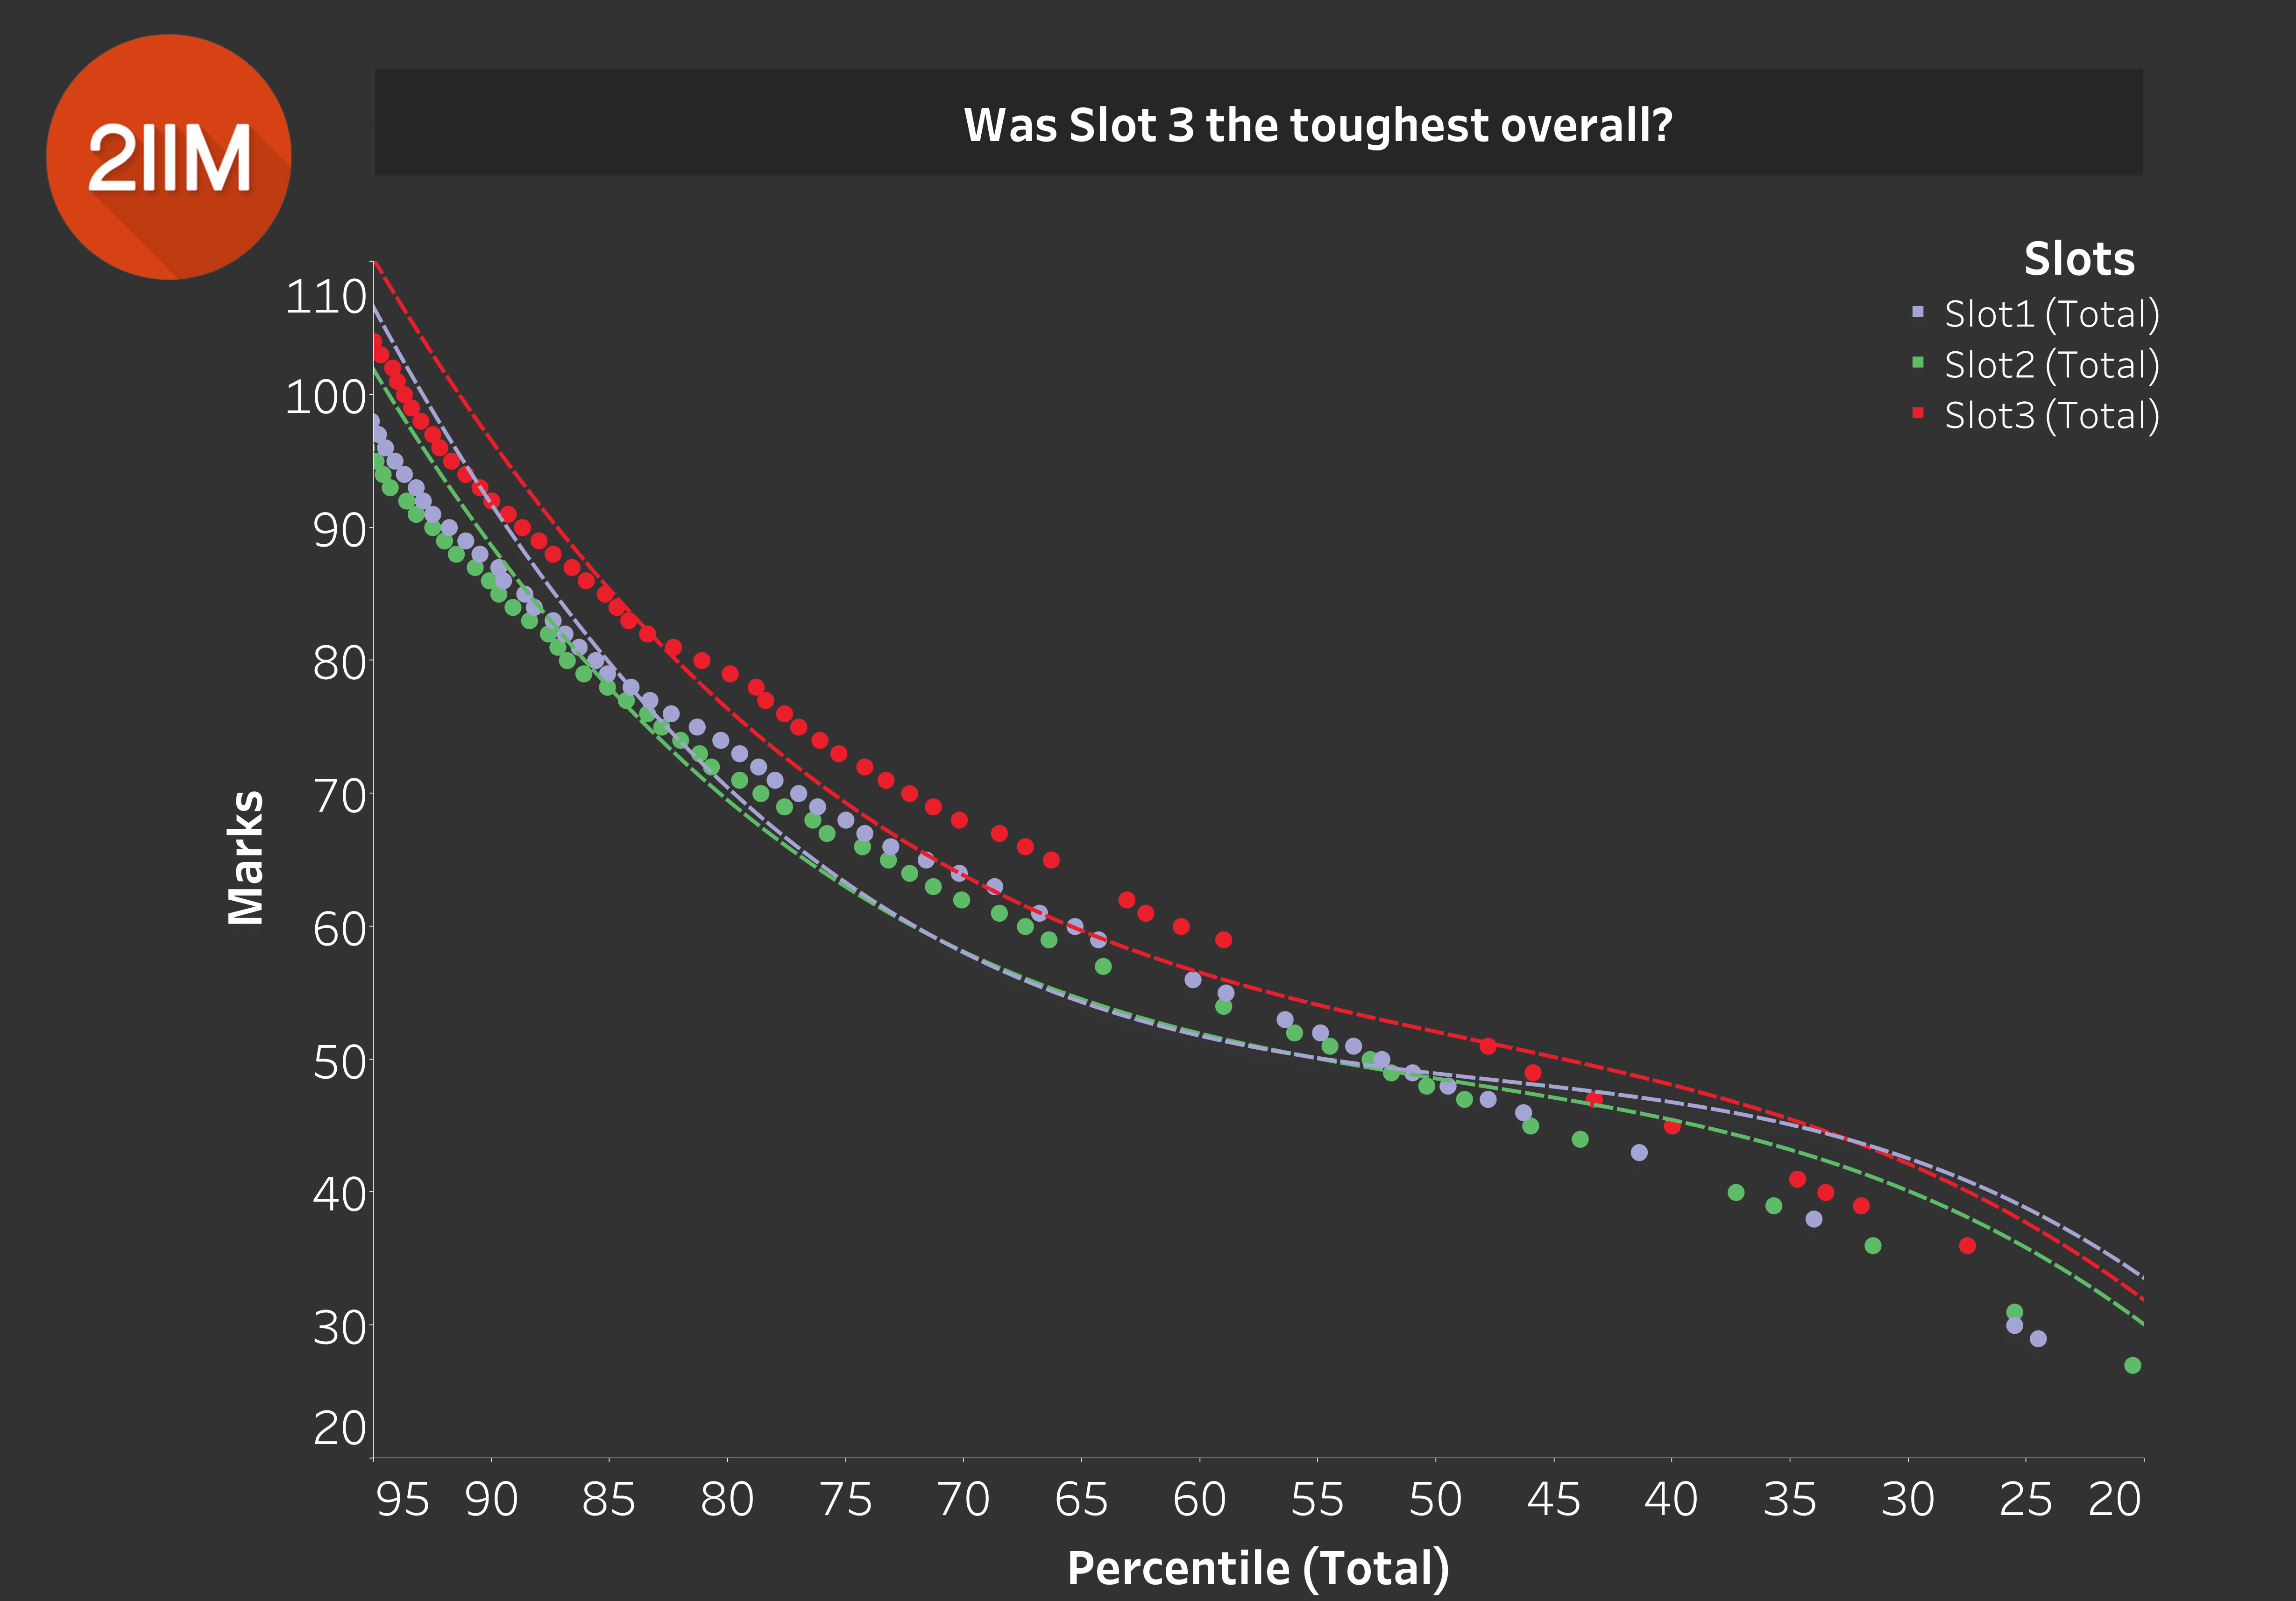
Table 6.0
We covered this earlier by thinking about this in terms of each of the sections. By approaching it by observing the data visualized on Table 6.0, we can see that the highest overall scores are from Slot 3.
Insight: If you take all the data points, Slot 3 is the easiest out of all the slots. Slot 1 was on the tougher side, and Slot 2 appears to be in the middle.
A lot of...expert (yours truly) opinions, immediately after the CAT seemed to be saying the exact opposite of this insight. I am guilty as charged on that count as well :P.
It is always difficult to compare difficulty levels for all three slots, given that one person takes just one slot. A lot of opinions post the CAT are based on anecdotal evidence.
So those of you who had a nightmarish time with Slot 1 VARC, know that it was definitely tougher than the other 2 slots, which is why in any form of normalization, Slot 1 VARC Scores will go up.
Wonderful! Now that we've talked about Slot Comparisons and Sectional Comparisons across Slots, we can speculate upon their impacts and take a stab at normalisation.
Normalization of Scores
The normalization of scores is absolutely lovely. What IIMCAT has done, is that they've provided their entire formula for it. They've anchored this around this nice metric 'G', which is the mean + standard deviation.
How it works is that they take the G for your slot, and they look at the overall G. They anchor your scores around your Slot's G and with the overall G, and then plug in their normalisation algorithm.
I am not going to dive into their algorithm now. It took us a long time to plug in their formula and compute the normalised scores. We do not claim to completely understand it but we followed the instructions to the bone.
Slot 1 - Normalisation
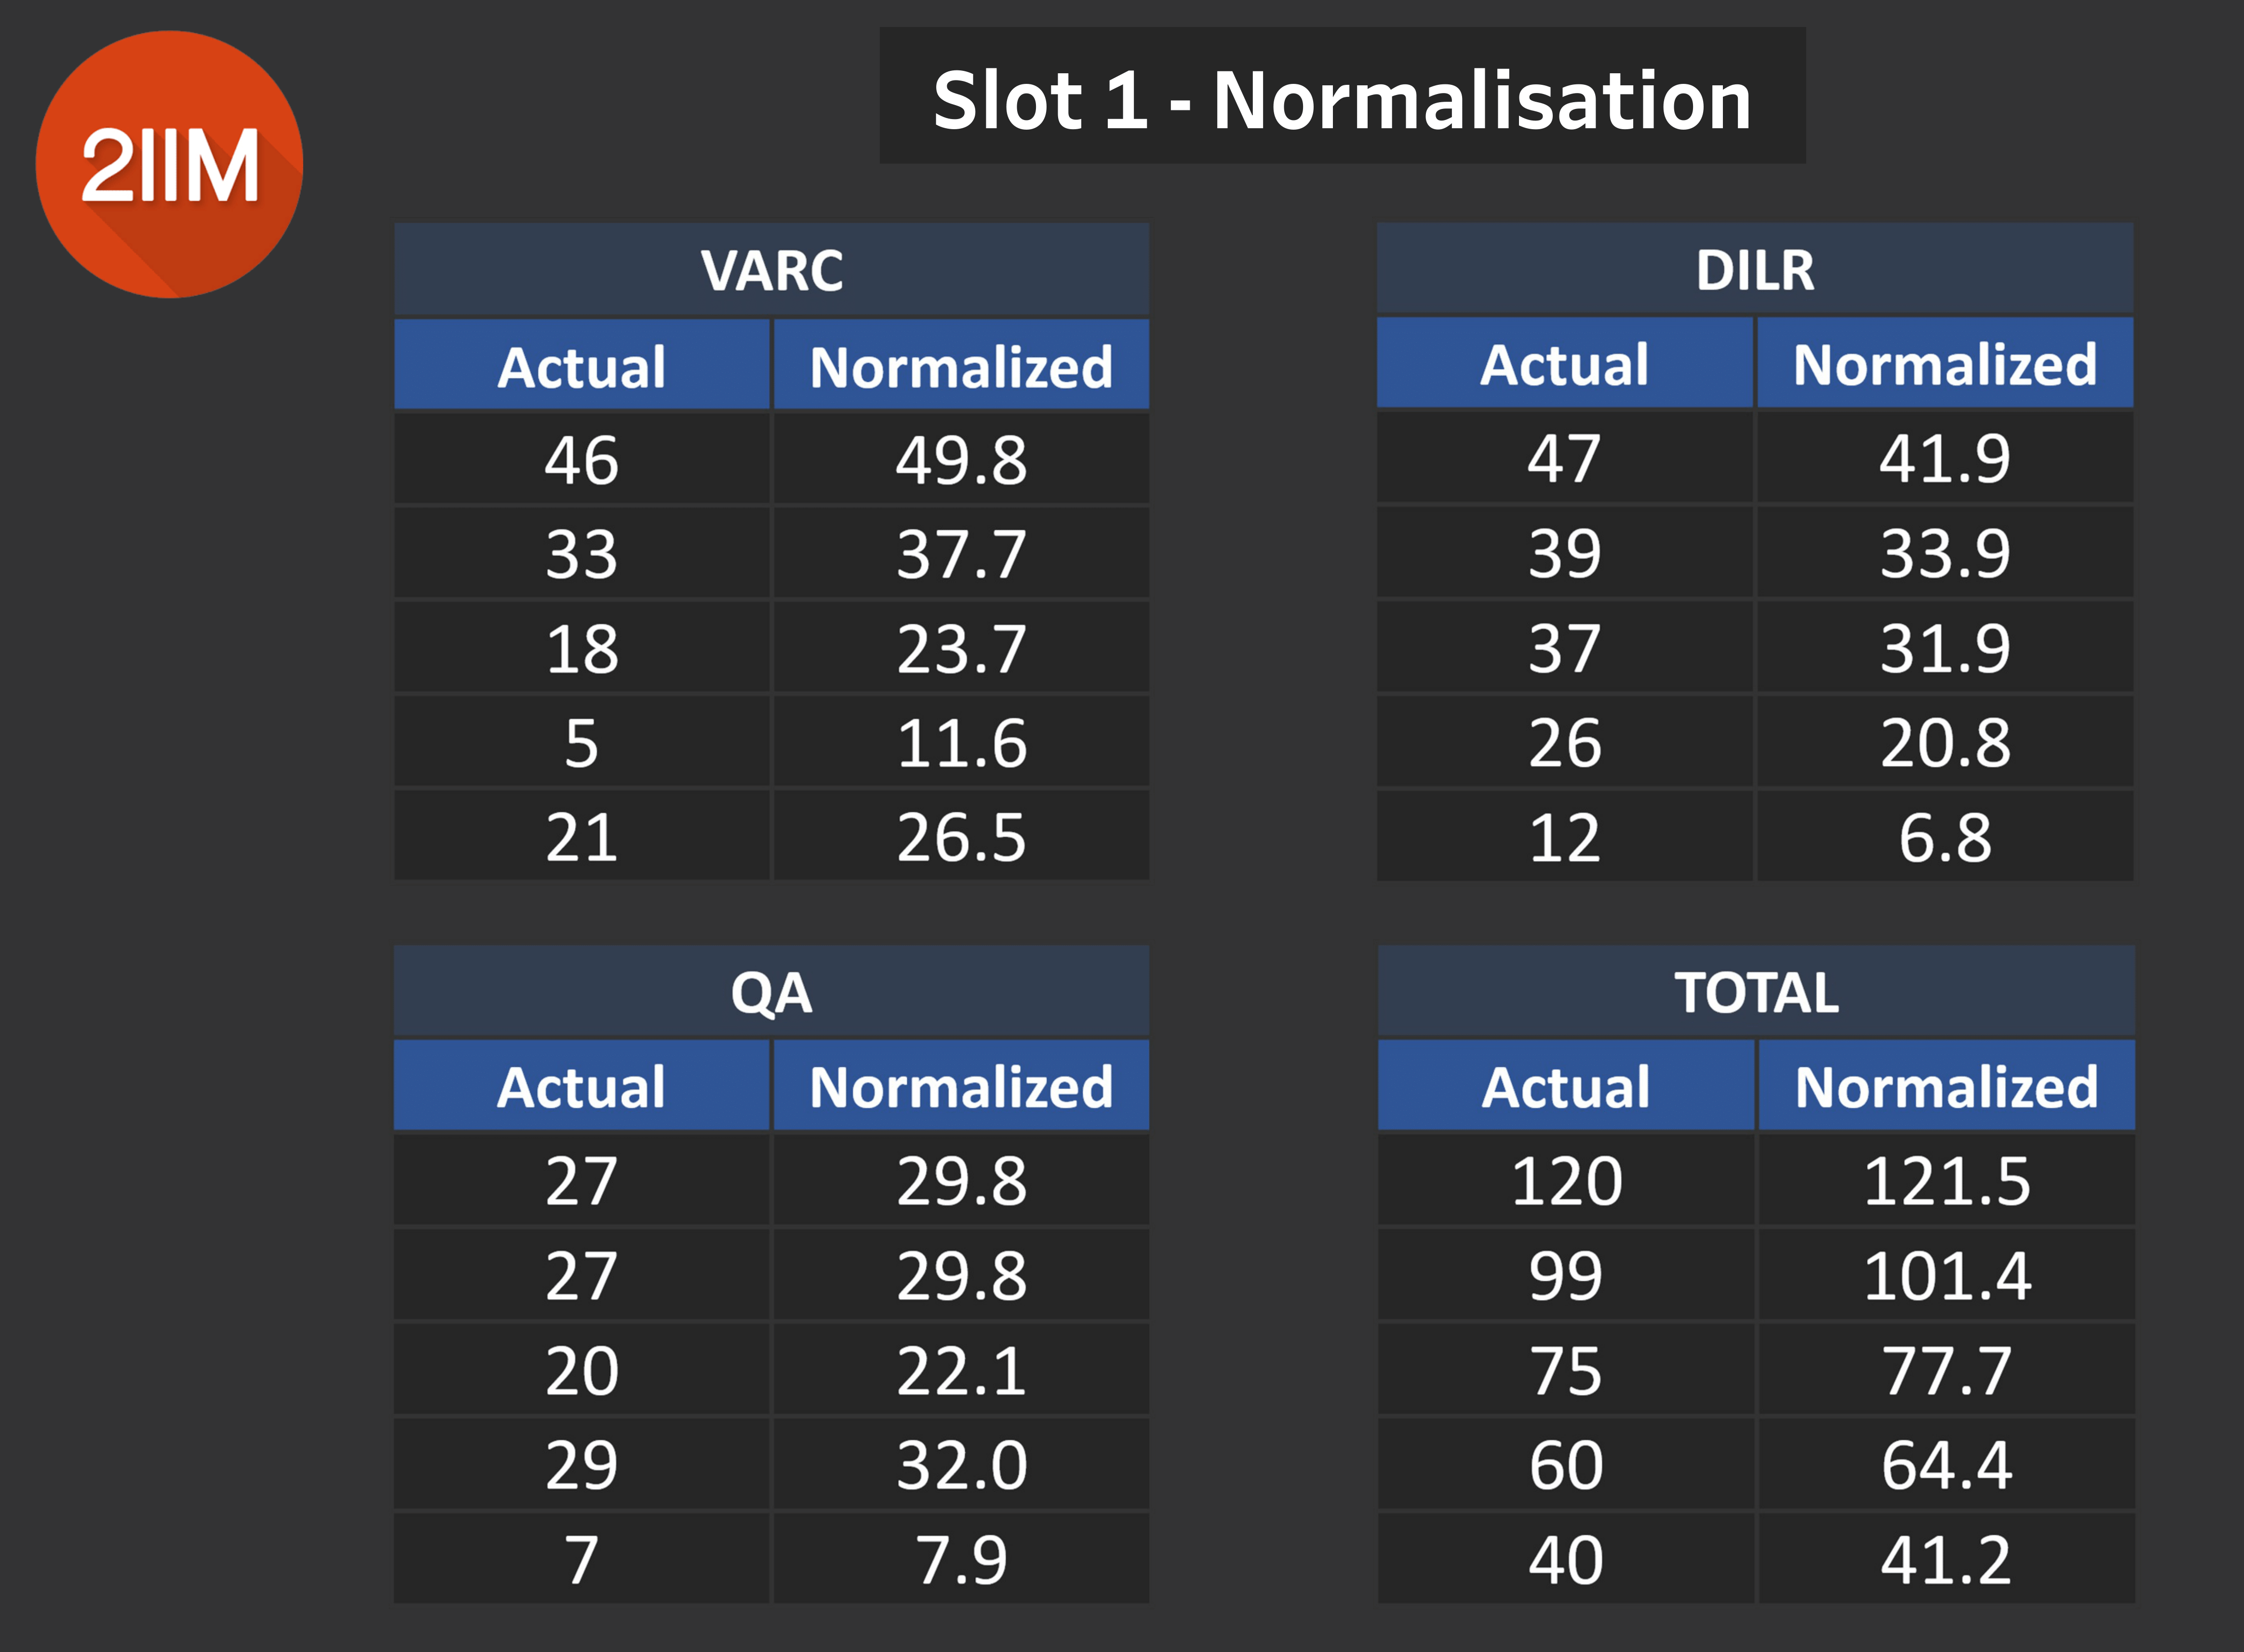
Table 7.0
- We've already seen that Slot 1 VARC was tougher than the other slots. So a score of 46 closely translates to a score of 50.
- The exact opposite happens for DILR, due to this section being easier in Slot 1 than in the other slots.
- The scores for Slot 1 Quant see a mild jump due to Slot 3 Quants being the toughest across other slots.
An important caveat: The score of 120 seen in Table 7.0 can be obtained through multiple nominations, say 40 - 40 - 40. So it is extremely important to note that your 120 in Slot need not mean a normalised score of 121.5.
In order to arrive at your normalised score, take your sectional normalised scores and then add them up to compute it.
For all intents and purposes, a jump of 8-9% in your VARC Scores, a dip of around 8-9% in your DILR Scores, and a modest 4% jump in your Quant Scores for Slot 1 is highly likely.
Different combinations will result in different overall normalised scores. I would love to reiterate that these charts are based on our data points and not the overall population of CAT Candidates. We don't claim to have access to the overall data set, so the numbers could vary... but we are reasonably confident.
Slot 2 - Normalisation
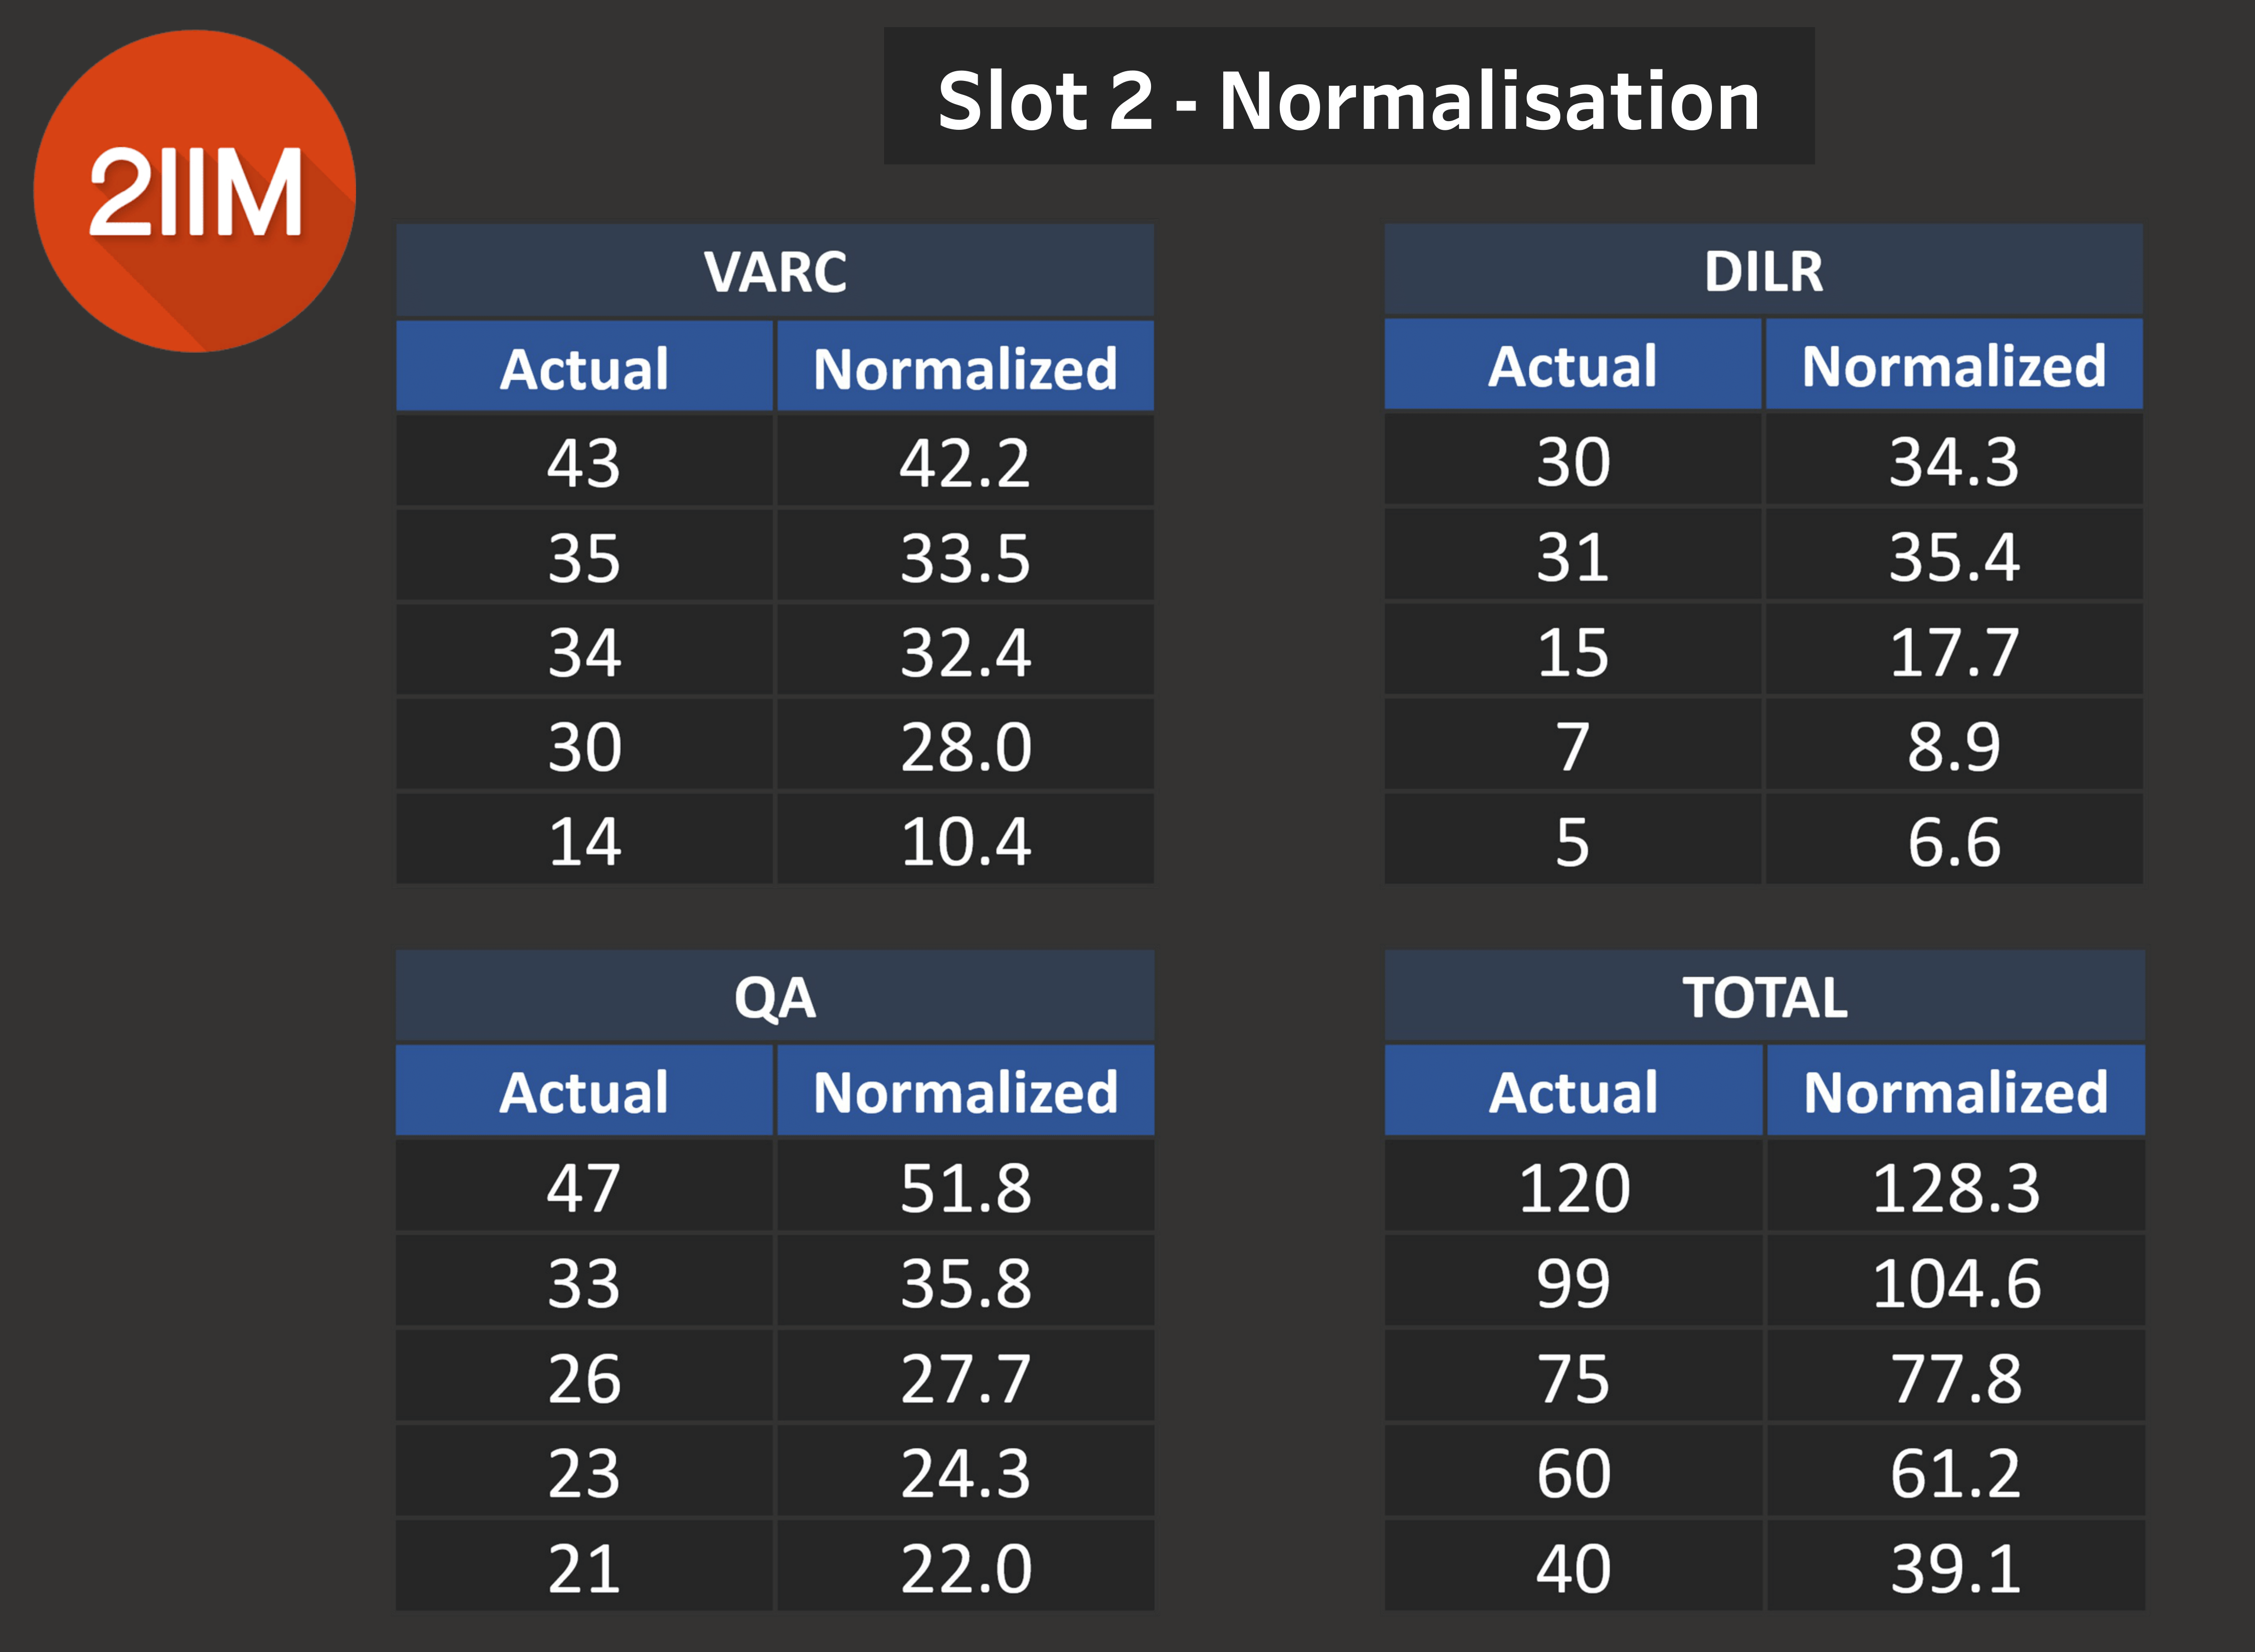
Table 8.0
- We've already seen that Slot 1 VARC was off-the-charts tougher than the other 2 Slots, so there is a mark down for Slot 2 VARC on a relative basis.
- Slot 2 DILR is going to see a mark up due to Slot 1 DILR being much easier than the other slots.
- Slot 2 Quants is also going to see a mark up due to Slot 3 Quants being much easier than the other slots.
- Your overall scores will also see a reasonable jump due to normalisation, but again remember that a 99 does not always mean a 104.5. It will depend on the combination of your sectional scores and the addition of their respective normalizations.
Slot 3 - Normalisation
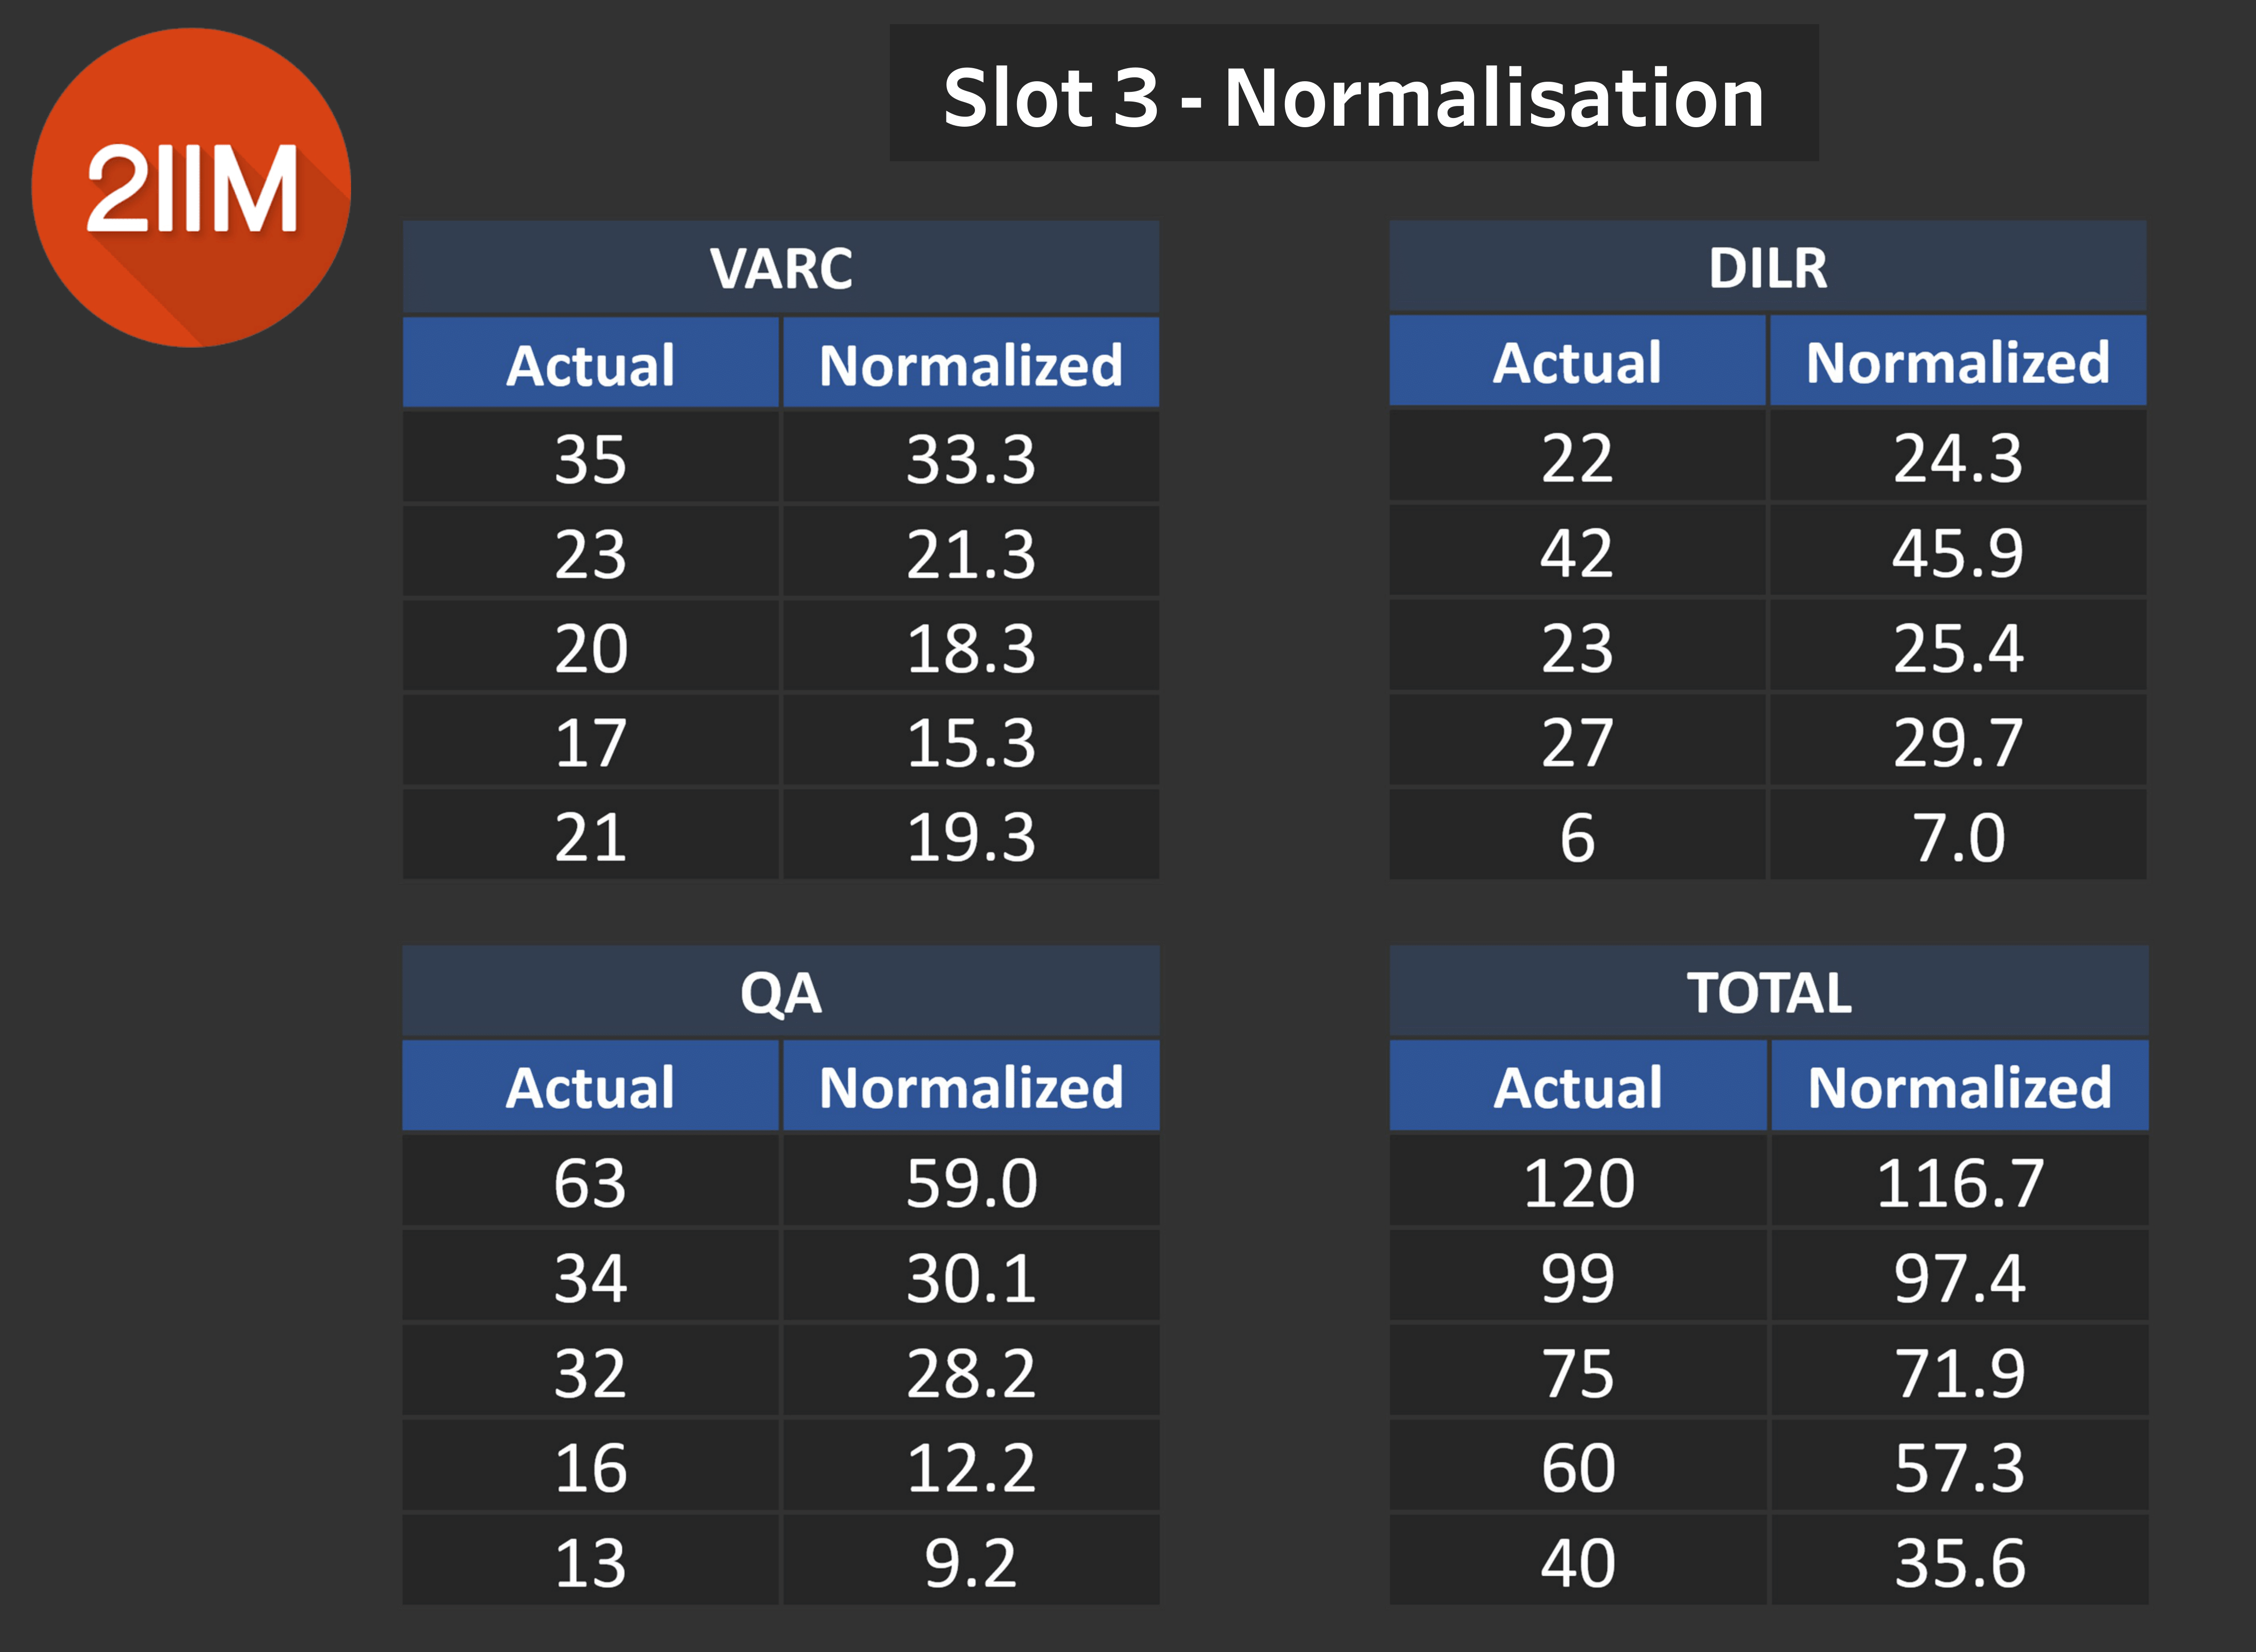
Table 9.0
Ah yes, the elephant in the room.
- Slot 3 VARC Scores will witness a slight mark down due to the toughness of Slot 1 VARC.
- Slot 3 DILR Scores will see a mark up due to Slot 1 DILR being easy.
- Slot 3 Quant Scores has a sharp mark down due to it being the easiest across all 3 slots. Many people actually figured that Slot 3 Quants was actually tough, maybe due to possible topic biases towards Coordinate Geometry.
- Another aspect is that the after the VARC and DILR Sections, many people felt that they were already being dealt a very tough slot, so that may have given us the feeling that Slot 3 was the toughest.
The Holy Grail - Sectional Cutoffs and Percentiles
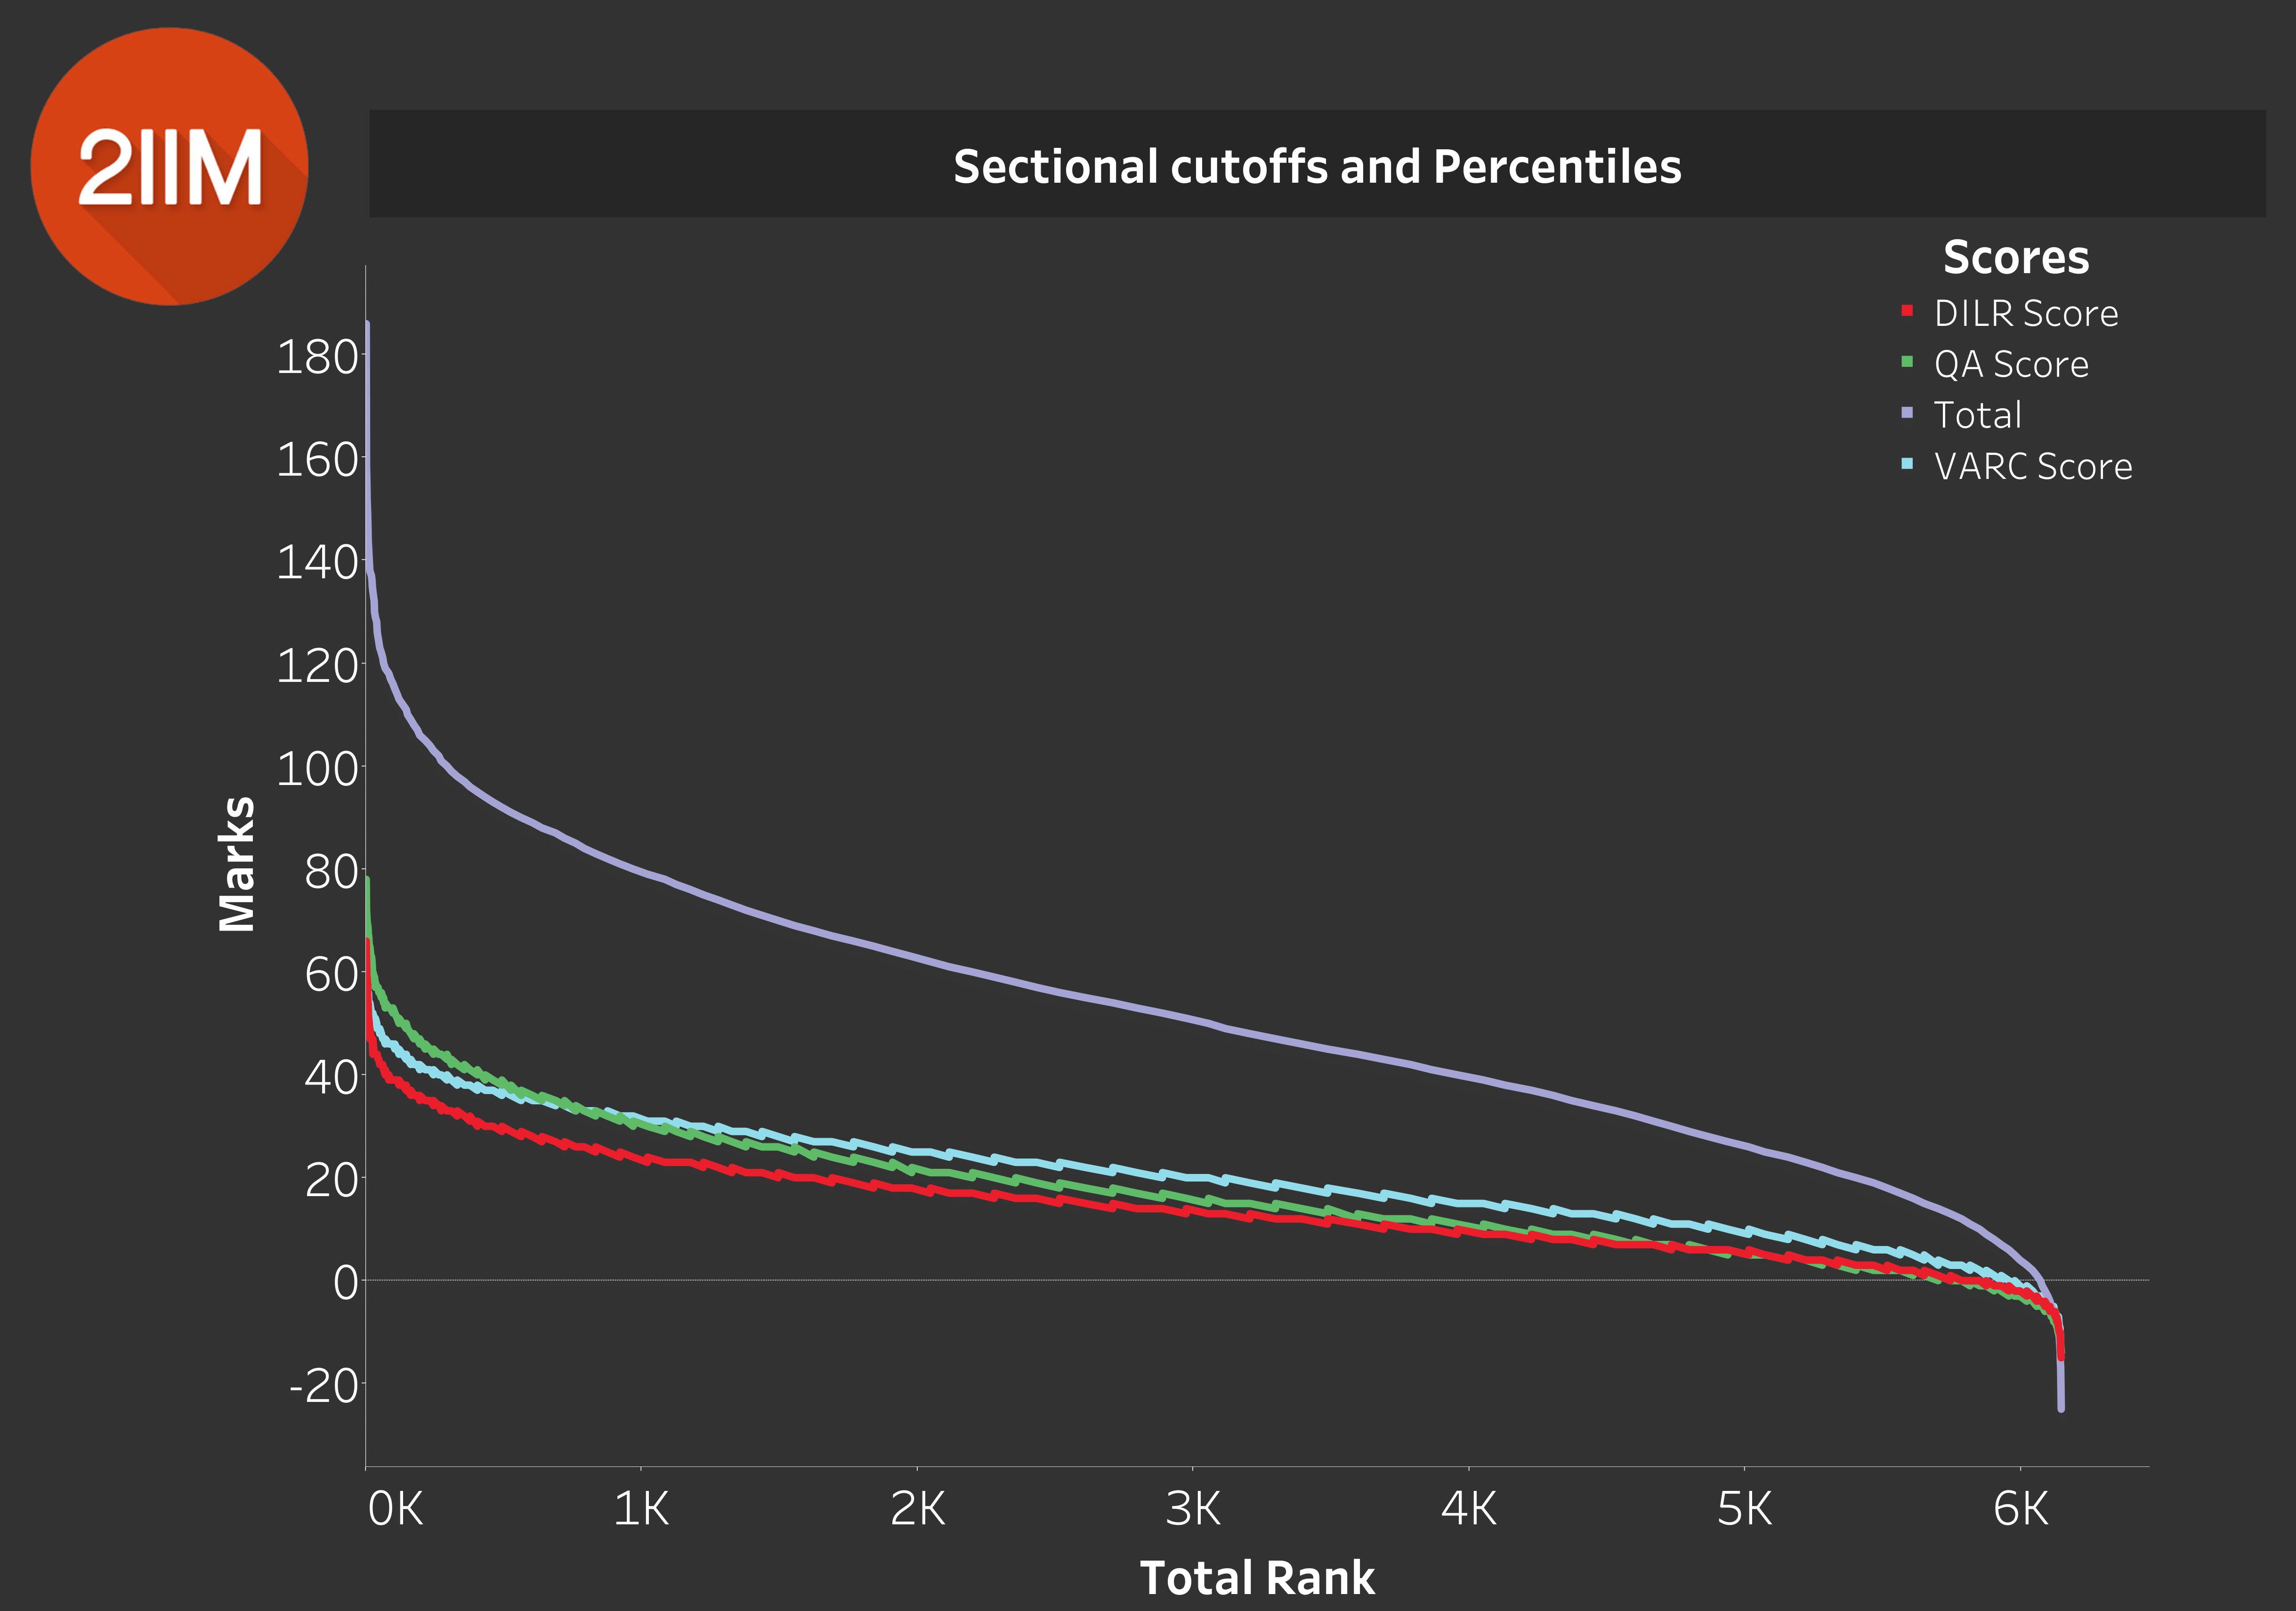
Table 10.0
We decided to take a stab at this after all. We had a tough time grabbing the whole percentile idea, because these things always involve some extrapolations, where the latter is not very natural.
We know that we have a sample of 6000, and we need to make an extrapolation to about x25. While the size isn't an issue, the bias sitting inside our sample definitely is. We mentioned before at the start of the article, that the more 'clued-in' candidates were the ones who submitted their entries to our Score Calculator.
So let us forget about, "what will be the scores for this percentile". Let's take the scores, and rank them instead. So what we did is (refer to Table 10.0) we took the Quant, DILR, VARC Scores, and the Overall Scores and ranked them in descending order.
On thing to remember in Table 10.0, is that each of the lines are independently categorized in the descending order. If you take one point in the graph and add the respective DILR, Quant and VARC Scores, it will NOT be equal to the Overall Scores above.
The student who is 3000th in Quant, is most likely not the student who is 3000th in VARC.
What Table 10.0 does give us, is a beautiful way to kind of straddle the ranking mechanism. What do I mean by that?
Suppose you have a sense of what the 98th percentile score is overall, then you can say what the 98th percentile for VARC, DILR and Quant is. Getting one number and anchoring it around the others, is a crucial exercise to get into.
I think that gives us an perspective of where the overall percentile lies.
Percentiles ahoy!
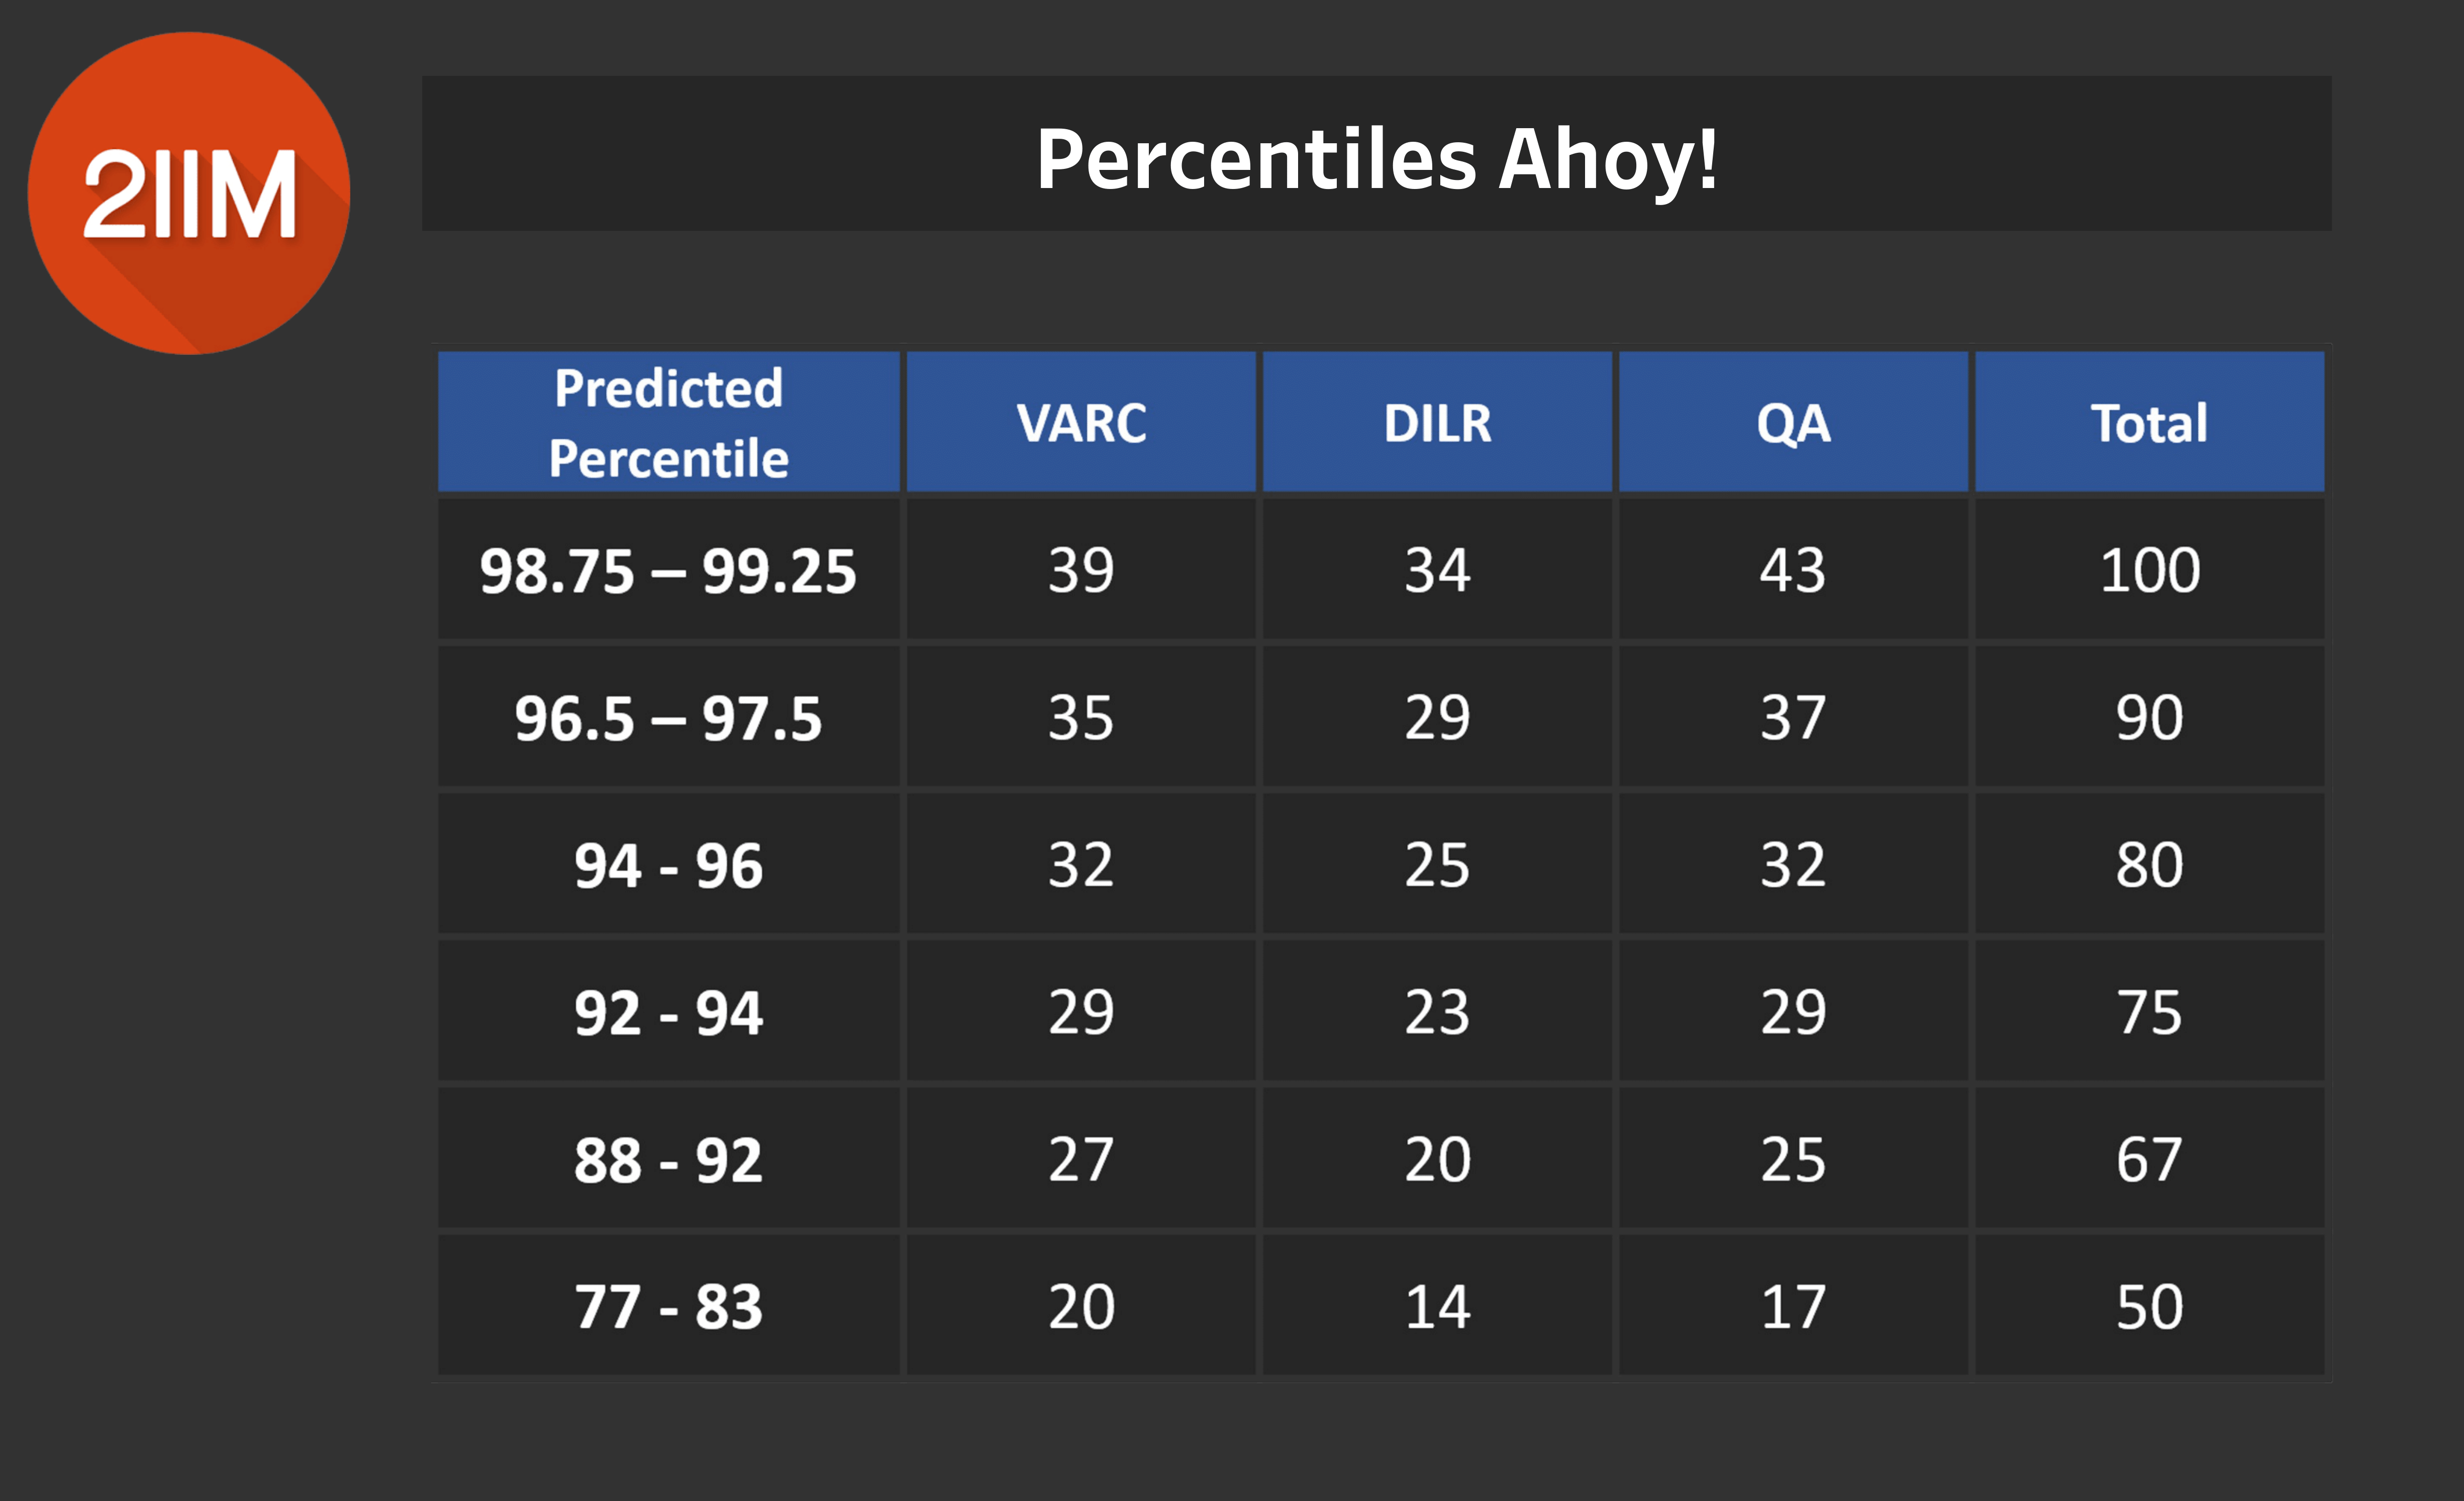
Table 11.0
Table 11.0 is obviously a crucial chart. What we've done here, is that we've asked for a score of 100, where is it likely to sit? We do not know what rank that score of 100 is, but we do know that whatever rank that overall 100 is, that is rank for the overall VARC, overall DILR and overall Quants.
Our gut feeling, is that a score of 100 is likely to be sitting between 98.75 to 99.25 percentile. This is a GUESS. There is no basis for it. What there is a basis for, is the overall scores and their corresponding overall sectional scores.
We spent a lot of time looking at the data, accounted for biases in the sample and took an educated guess for the percentiles. What we are confident in is that a score of 100 should correspond to the given sectional scores, as shown in Table 11.0.
Why we've taken a guess is that sometimes one feels reassured by them or at the very least are aware of the fact that their score could lie in this xyz percentile range. We wanted to stay away from rigid, expected percentiles. Our range of accuracy, keeping in mind our sample, is not going to be enough for percentiles either. So we've just taken a stab at it.
Also, don't forget to refer to our normalisation tables and account for those when you're looking at Table 11.0. Remember, there is no guarantee that these guesstimated percentiles are close to reality. They are merely an indication based on our mechanism. This is why it was important for us to take you through our whole process.
Kindly, remember to NOT jump the gun. There is very to do but WAIT for your results.
A Final Note
Those of you who are reasonably confident after seeing your response sheets, look to start preparing for your PI. Read a few reasonably good newspapers.
For those of you thinking about applying to colleges and you're not sure which colleges to apply for, or are just not sure whether you should even apply, definitely err on the side OF applying. The cost of applying is very small compared to the cost of an MBA. You've come this far, prepared so much and are emotionally invested, so definitely apply. You can decide if you want to go or not later.
Reach out to us (on our multiple platforms) if you have any queries on our data and methods. The best research based on our data set will definitely be published on our blogs. Try it out and have fun! Remember, the CAT is just an exam.
Stay Safe and Best Wishes!