CAT 2018 Question Paper | CAT LR DI
CAT Previous Year Paper | CAT DILR | Set 4
 CAT Questions
 This set seems to be a nightmare on the first sight, but the questions are thankfully not at all difficult, provided if you plug in all the data. This one can be cracked if you gave a good hold on percentages. The pie chart type questions are common in the CAT exam and they are also pretty doable. So, it is advisable to solve myriad data interpretation problems before you begin your mocks during your online preparation for CAT. Now, try this fabulous question and see if you are able to have a crack at it.
CAT DILR : CAT 2018 Question Paper Slot 1
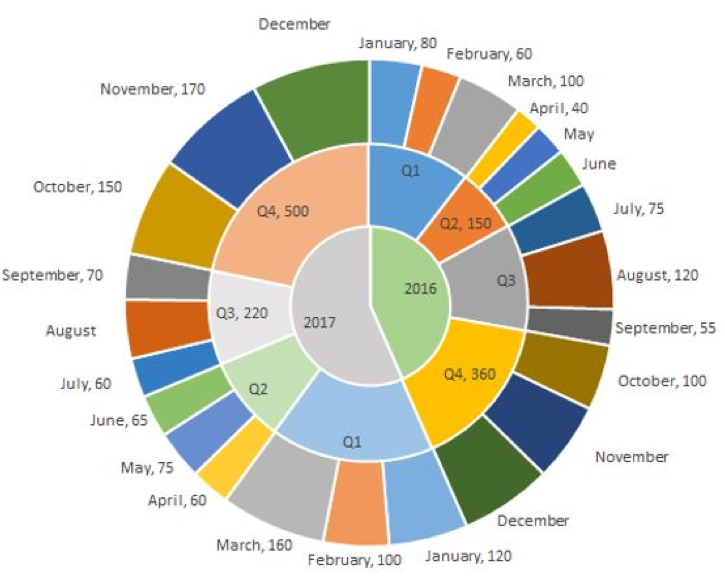
Set 4 : LED TV Sales
The multi-layered pie-chart below shows the sales of LED television sets for a big retail electronics outlet during 2016 and 2017. The outer layer shows the monthly sales during this period, with each label showing the month followed by sales figure of that month. For some months, the sales figures are not given in the chart. The middle-layer shows quarter-wise aggregate sales figures (in some cases, aggregate quarter-wise sales numbers are not given next to the quarter). The innermost layer shows annual sales. It is known that the sales figures during the three months of the second quarter (April, May, June) of 2016 form an arithmetic progression, as do the three monthly sales figures in the fourth quarter (October, November, December)of that year.
Question 2 :In which quarter of 2017 was the percentage increase in sales from the same quarter of 2016 the highest?
- Q2
- Q4
- Q1
- Q3
Best CAT Online Coaching
Try upto 40 hours for free
Learn from the
best!
2IIM : Best Online CAT Coaching.
Video Explanation
Best CAT Coaching in Chennai
CAT Coaching in Chennai - CAT 2022
Limited Seats Available - Register Now!
Explanatory Answer
Method of solving this CAT Question on CAT DILR
Let us fill the simple numbers first.
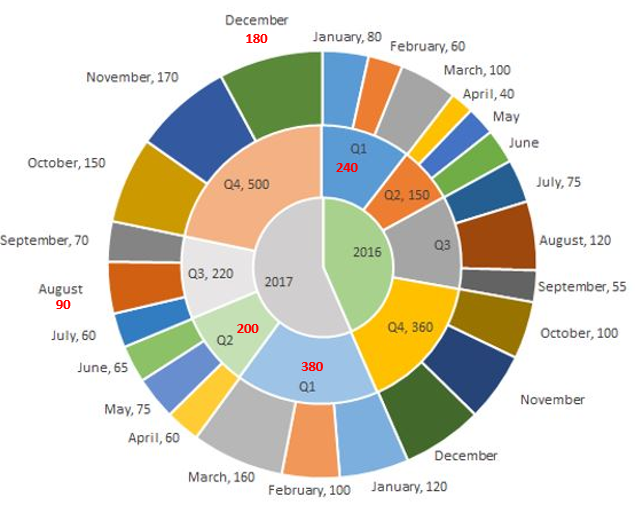
Now, let us get to the two Arithmetic Progressions. It is known that the sales figures during the three months of the second quarter (April, May, June) of 2016 form an arithmetic progression, as do the three monthly sales figures in the fourth quarter (October, November, December)of that year.
Three terms are in AP, the middle term is the average of the three terms. So, May 2016 number is 50. And November 2016 should be 120.
Three terms are in AP, the middle term is the average of the three terms. So, May 2016 number is 50. And November 2016 should be 120.
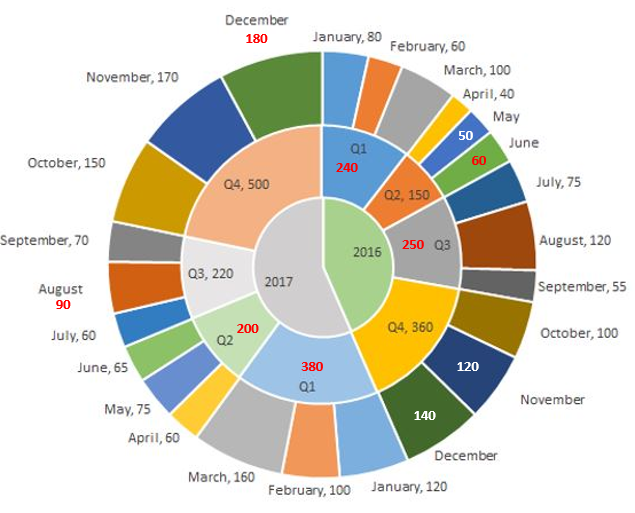
Now, we can get the June and December numbers as well.
We are comparing \\frac{140}{240}), \\frac{50}{150}), \\frac{(-ve)}{250}), \\frac{140}{360}) to find the largest value.
\\frac{(-ve)}{250}) is negative and therefore it is ruled out as we need percentage increase.
\\frac{50}{150}) is \\frac{1}{3}) and \\frac{140}{240}) is more than \\frac{1}{3}) and therefore the former is ruled out.
Now we have to compare \\frac{140}{240}) and \\frac{140}{360}). Both have same numerator but one has smaller denominator than the other.
Smaller the denominator , larger the value and therefore \\frac{140}{240}) is the largest of all.
Therefore in 2017, Q1 saw the highest percentage increase in sales when compared to it's 2016 counterpart.
The question is "In which quarter of 2017 was the percentage increase in sales from the same quarter of 2016 the highest?"
Hence, the answer is Q1
Choice C is the correct answer.