CLAT Quantitative Techniques
CLAT Quantitative Techniques section tests candidates on two tenets – Data Interpretation ability, and Mathematical & Computational skills. Data Interpretation requires comprehending data from Line Graphs, Bar Graphs, Pie Charts and the like. Computational skills can be honed with a basic understanding of mathematical concepts like Percentages, Averages, and Ratios and Proportions.
The following questions on CLAT Quantitative Techniques have been curated meticulously, taking into account the latest samples released by the Consortium of NLUs. These questions are pegged exactly at the level of difficulty of CLAT.
Are you game for some number crunching? Take the plunge, and solve the following questions, available for free!
CLAT 2020 Quantitative Techniques: Geometry
In the figure given below, a goat is tied to a pole (at point O) which is the center of the semi -circular plot. The area of the plot is equal to its perimeter. BO is the length of the rope through which the goat is tied to the pole. Answer to the closest decimal.
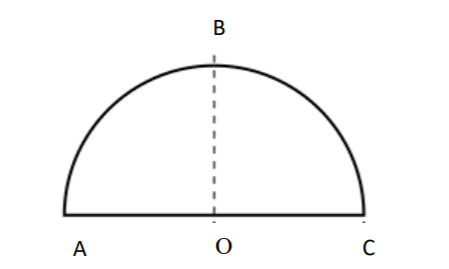
What will be the area of the triangle ABC?
- 6.96
- 9.66
- 3.66
- Can‘t be calculated with the given data
Explanatory Answer
Since, the position of B isn't explicitly mentioned(though evident fro the diagram),
we can't proceed further.


CAT Coaching in Chennai
CAT 2021
Enroll at 49,000/-
44,000/-
Online Classroom Batches Starting Now!