CLAT Quantitative Techniques
CLAT Quantitative Techniques section tests candidates on two tenets – Data Interpretation ability, and Mathematical & Computational skills. Data Interpretation requires comprehending data from Line Graphs, Bar Graphs, Pie Charts and the like. Computational skills can be honed with a basic understanding of mathematical concepts like Percentages, Averages, and Ratios and Proportions.
The following questions on CLAT Quantitative Techniques have been curated meticulously, taking into account the latest samples released by the Consortium of NLUs. These questions are pegged exactly at the level of difficulty of CLAT.
Are you game for some number crunching? Take the plunge, and solve the following questions, available for free!
CLAT 2020 Quantitative Techniques: Japanese Encephalitis
The following data presents the cases of Japanese Encephalitis in five states of India
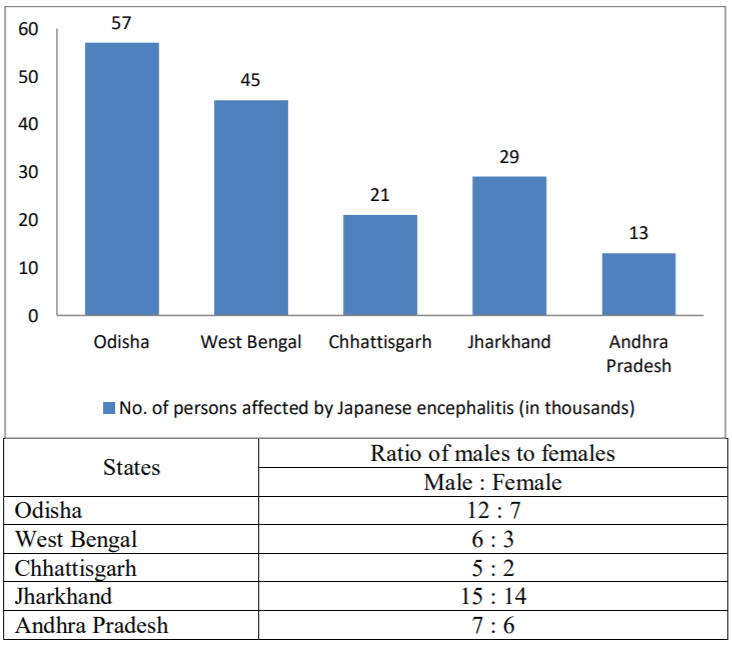
What is the average number of males affected by Japanese encephalitis in all the five states?
- 9,000
- 13,500
- 18,400
- 20,600
Explanatory Answer
Let's calculate the number of males affected by encephalitis in each state...
Number of males affected in a state \(=\frac{\text { ratio of males }}{\text { total ratio }} \times \text { Total number of people effected by encephalitis in a particular state }\)
Number of males affected in Odisha \(=\frac{12}{19} \times 57000=36000\)
Number of males affected in West Bengal \(=\frac{6}{9} \times 45000=30000\)
Number of males affected in Chattisgarh \(=\frac{5}{7} \times 21000=15000\)
Number of males affected in Jharkhand \(=\frac{15}{29} \times 29000=15000\)
Number of males affected in Andhra Pradesh \(=\frac{7}{13} \times 13000=7000\)
The average number of males affected in the 5 states \(=\frac{(36000+30000+15000+15000+7000)}{5}=20,600\)


CAT Coaching in Chennai
CAT 2021
Enroll at 49,000/-
44,000/-
Online Classroom Batches Starting Now!